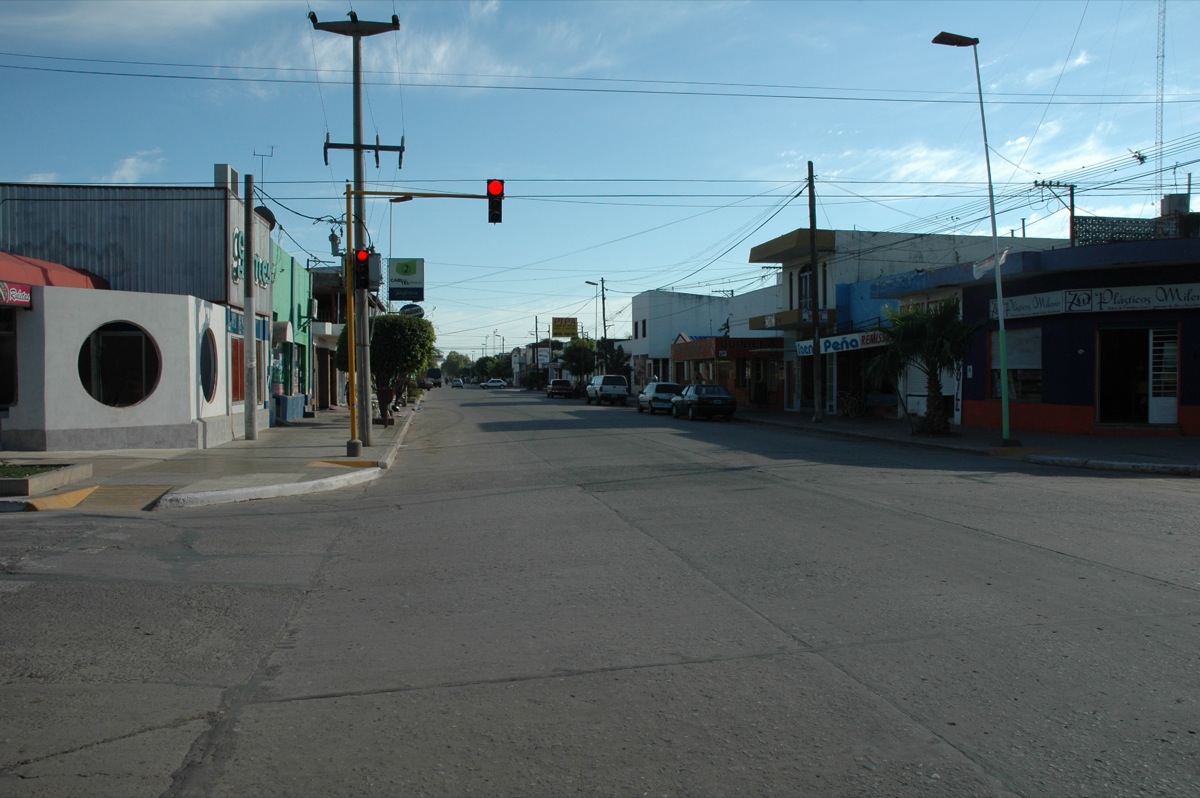
産業
Corzuelaにおける業界別ビジネス分布
| 業界の説明 | 事業所数 |
|---|---|
| 食料雑貨品店・スーパーマーケット | 25 |
| ショッピング | 22 |
| 服屋 | 17 |
| レストラン | 10 |
| 教育 | 9 |
| 電気店 | 6 |
| 薬局・ドラッグストア | 6 |
| ガソリンスタンド | 5 |
Corzuelaのデータ
| エリア | 2.9 km² |
| 人口 | 7,944 |
| 人口変化 (1975 to 2020) | +24.7% |
| 人口変化 (2000 to 2020) | -18.9% |
| 市外局番 | 3731 |
| 現地時間 | |
| 時間帯 | アルゼンチン標準時 |
| 緯度と経度 | -26.95374, -60.96928 |
Corzuelaの地図
インタラクティブマップ
Corzuelaの人口
1975年から2030年
| Data | 1975 | 1990 | 2000 | 2015 | 2020 | 2025* | 2030* |
|---|---|---|---|---|---|---|---|
| 人口 | 6,369 | 8,673 | 9,793 | 11,779 | 7,944 | 7,988 | 7,905 |
| 人口密度 | 2,168.2 / km² | 2,952.5 / km² | 3,333.8 / km² | 4,009.9 / km² | 2,704.3 / km² | 2,719.3 / km² | 2,691.1 / km² |
* 予測値
情報源: JRC (European Commission's Joint Research Centre) の作業 GHS built-up gridCorzuelaの2000年から2020年までの人口変化
2000年から2020年にかけて18.9%減少
| 場所 | 1975年以降の変化 | 1990年以降の変化 | 2000年以降の変化 |
|---|---|---|---|
| Corzuela | +24.7% | -8.4% | -18.9% |
| チャコ州 | — | — | — |
| アルゼンチン | — | — | — |
情報源: JRC (European Commission's Joint Research Centre) の作業 GHS built-up grid
Corzuelaの人口密度
人口密度: 2,704 / km²
| 場所 | 人口 | エリア | 密度 |
|---|---|---|---|
| Corzuela | 7,944 | 2.938 km² | 2,704 / km² |
| チャコ州 | 1.1 million | 99,701.1 km² | 11.2 / km² |
| アルゼンチン | 43.2 million | 2,779,516.9 km² | 15.5 / km² |
情報源: JRC (European Commission's Joint Research Centre) の作業 GHS built-up grid
Corzuelaの過去および予測人口
1850年から2100年までの推定人口
情報源:
- JRC (European Commission's Joint Research Centre) の作業 GHS built-up grid
- CIESIN (Center for International Earth Science Information Network)
- [リンク] Klein Goldewijk, K., Beusen, A., Doelman, J., and Stehfest, E.: Anthropogenic land use estimates for the Holocene – HYDE 3.2, Earth Syst. Sci. Data, 9, 927–953, https://doi.org/10.5194/essd-9-927-2017, 2017.
人間開発指数(HDI)
平均余命、教育、および一人当たり収入の統計的複合指数。
出典: [リンク] Kummu, M., Taka, M. &Guillaume, J. 1990年から2015年までのGDPおよび人間開発指数のグローバルグリッドデータセット. Sci Data 5, 180004 (2018) doi:10.1038/sdata.2018.4
CorzuelaのCO2排出量
1人あたりの二酸化炭素(CO2)排出量(年間トン)
| 場所 | CO2排出量 | 一人当たりのCO2排出量 | CO2排出強度 |
|---|---|---|---|
| Corzuela | 29,564 tn | 3.72 tn | 10,064.2 tons/km² |
| チャコ州 | 4,401,219 tn | 3.93 tn | 44.1 tons/km² |
| アルゼンチン | 198,107,945 tn | 4.59 tn | 71.3 tons/km² |
情報源: [リンク] Moran, D., Kanemoto K; Jiborn, M., Wood, R., Többen, J., and Seto, K.C. (2018) 13,000都市のカーボンフットプリント. Environmental Research Letters DOI: 10.1088/1748-9326/aac72a
CorzuelaのCO2排出量
| 2013年のCO2排出量(トン/年) | 29,564 tn |
| 2013年の一人当たりCO2排出量(トン/年) | 3.72 tn |
| 2013年のCO2排出強度(トン/km²/年) | 10,064.2 tons/km² |
自然災害リスク
10のうちの相対リスク
| ハザード | リスクレベル |
|---|---|
| 干ばつ | 中 (4) |
| 洪水 | 中 (7) |
| 地震 | 低 (2) |
*特に洪水または地滑りに関するリスクは、地域全体に及ぶとは限りません。
情報源:
- Dilley, M., R.S. Chen, U. Deichmann, A.L. Lerner-Lam, M. Arnold, J. Agwe, P. Buys, O. Kjekstad, B. Lyon, and G. Yetman. 2005. Natural Disaster Hotspots: A Global Risk Analysis. Washington, D.C.: World Bank. https://doi.org/10.1596/0-8213-5930-4.
- Center for Hazards and Risk Research - CHRR - Columbia University, Center for International Earth Science Information Network - CIESIN - Columbia University, and International Research Institute for Climate and Society - IRI - Columbia University. 2005. Global Drought Hazard Frequency and Distribution. Palisades, NY: NASA Socioeconomic Data and Applications Center (SEDAC). https://doi.org/10.7927/H4VX0DFT.
- Center for Hazards and Risk Research - CHRR - Columbia University, Center for International Earth Science Information Network - CIESIN - Columbia University. 2005. Global Flood Hazard Frequency and Distribution. Palisades, NY: NASA Socioeconomic Data and Applications Center (SEDAC). https://doi.org/10.7927/H4668B3D.
- Center for Hazards and Risk Research - CHRR - Columbia University, Center for International Earth Science Information Network - CIESIN - Columbia University. 2005. Global Earthquake Hazard Distribution - Peak Ground Acceleration. Palisades, NY: NASA Socioeconomic Data and Applications Center (SEDAC). https://doi.org/10.7927/H4BZ63ZS.
データについて
このページのデータは、公開されている各種ツールやリソースを用いて推定されています。保証なしで提供されており、不正確な情報が含まれる可能性があります。ご自身の責任でご利用ください。