産業
Buffalo Narrowsにおける業界別ビジネス分布
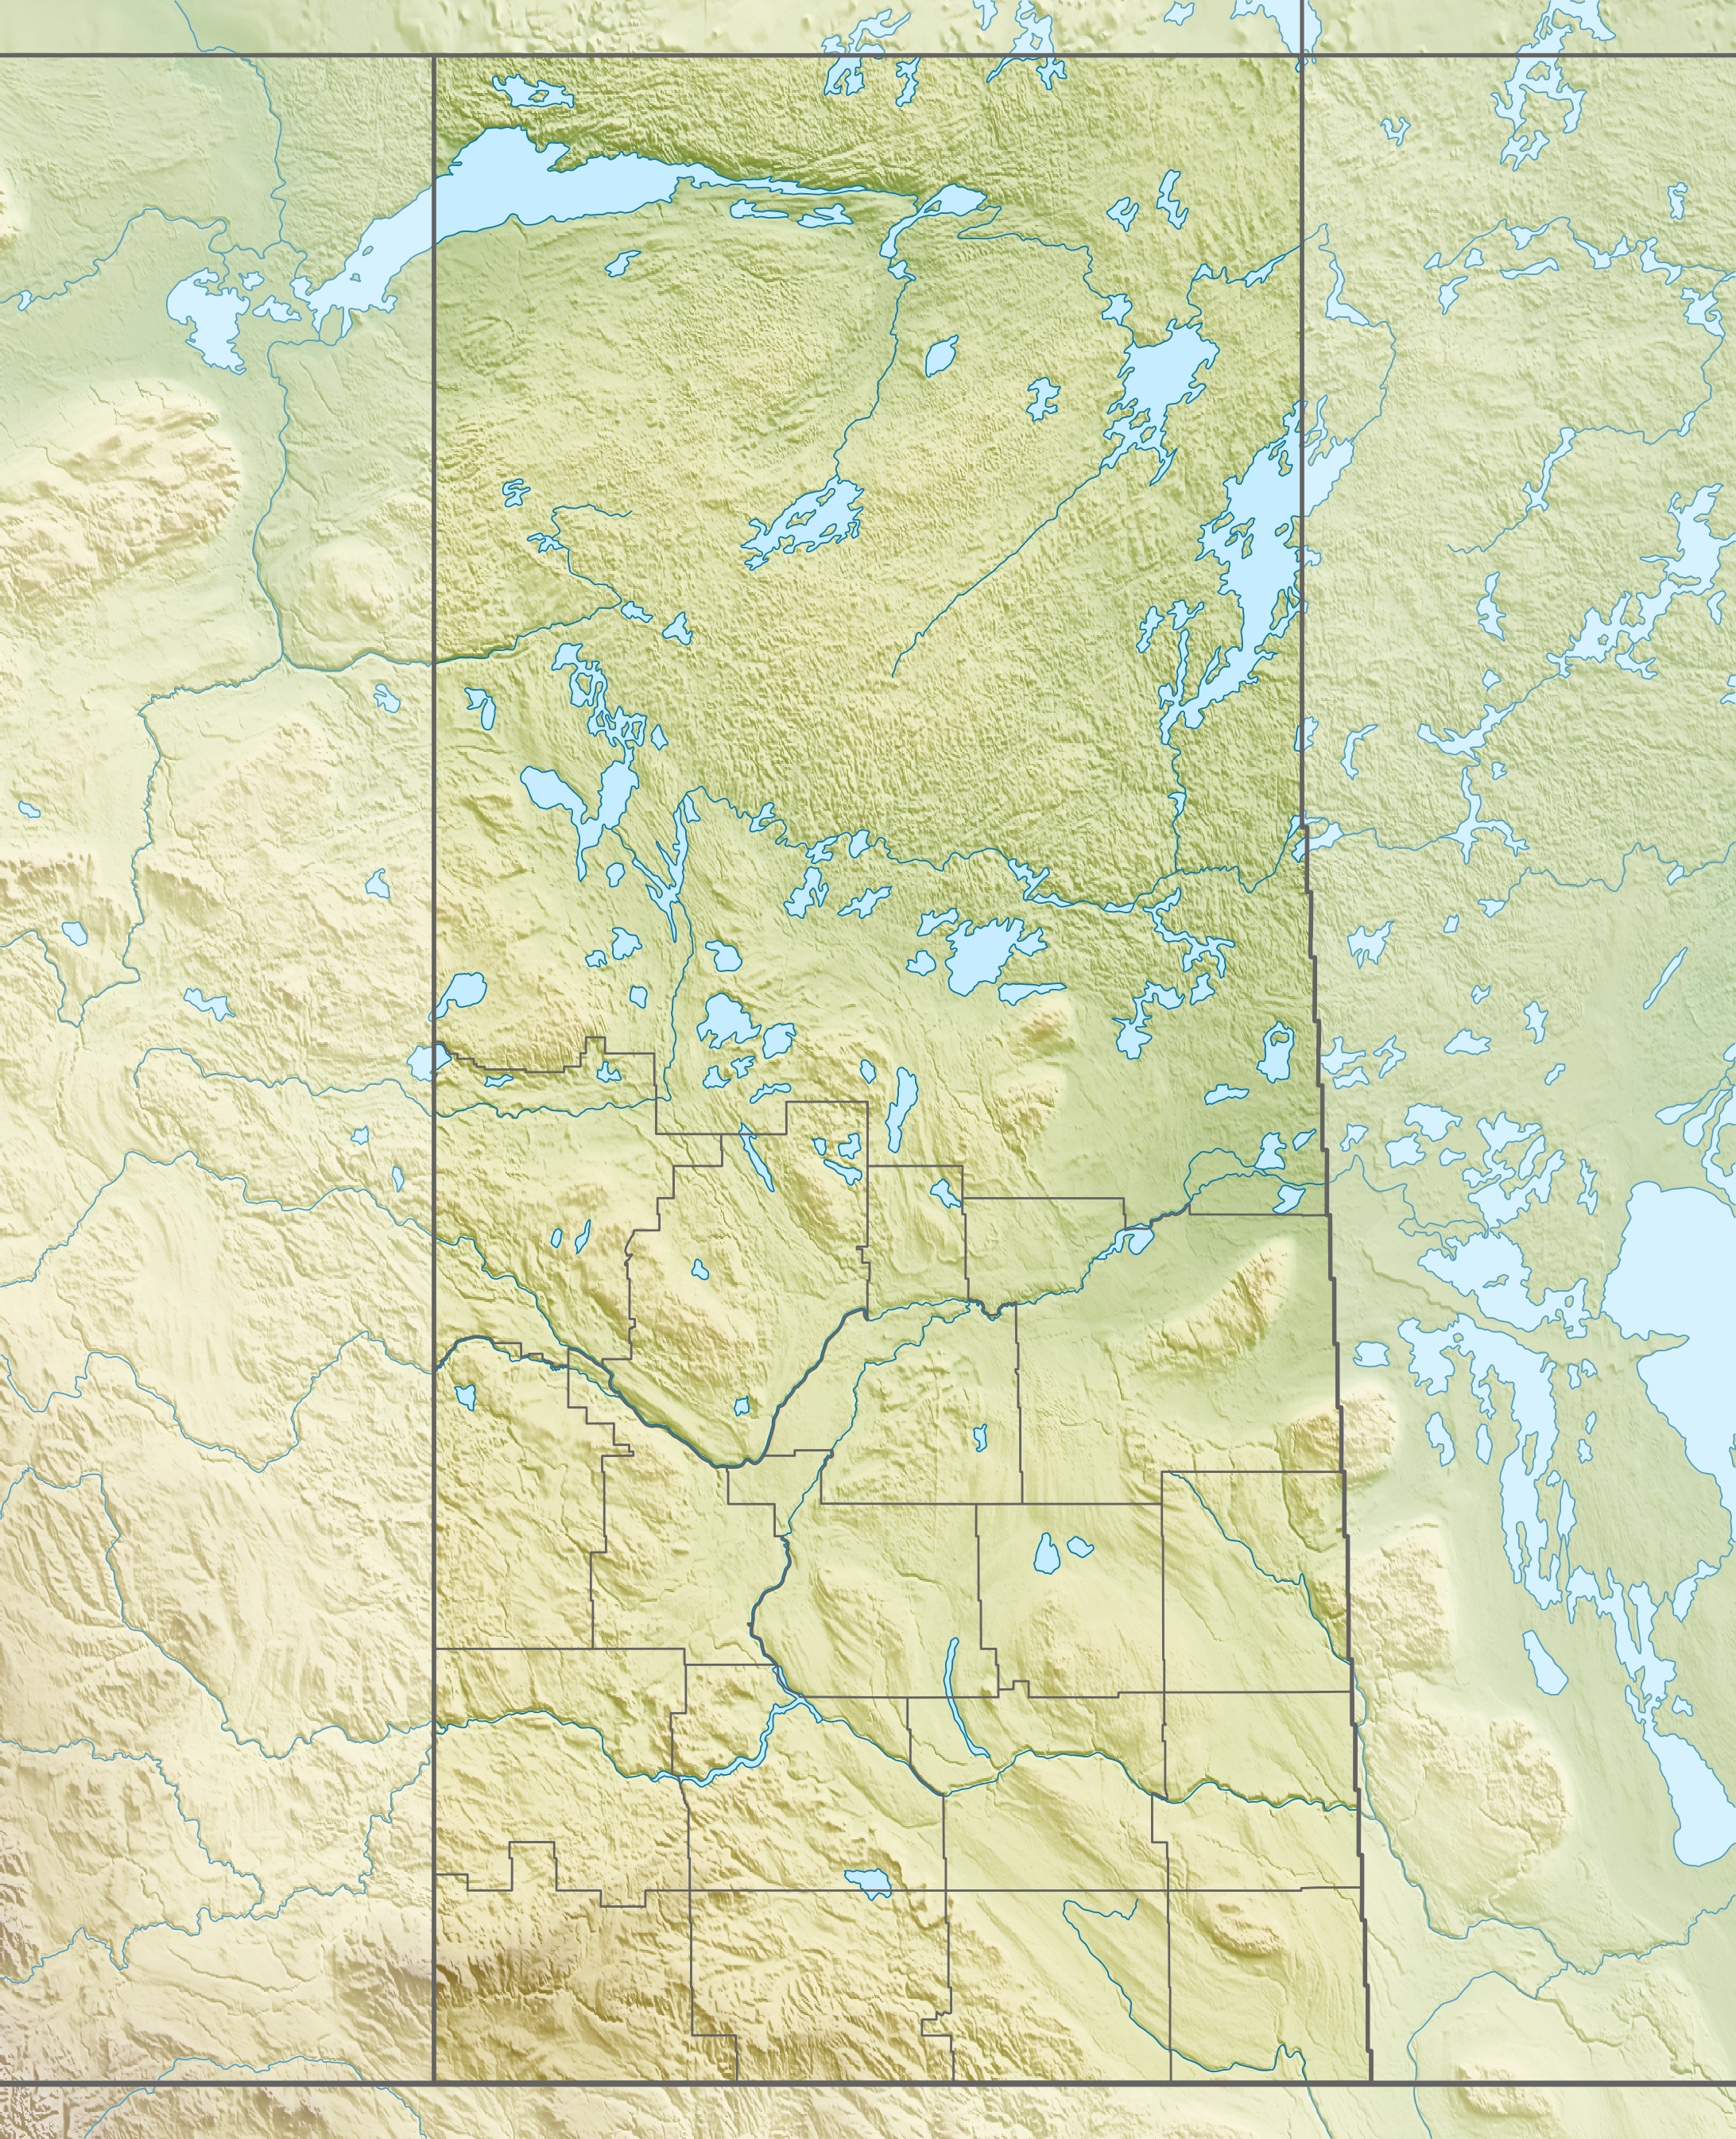
Buffalo Narrowsの地図
インタラクティブマップ
Buffalo Narrowsの人口
1975年から2020年
| Data | 1975 | 1990 | 2000 | 2015 | 2020 |
|---|---|---|---|---|---|
| 人口 | 635 | 828 | 963 | 1,197 | 1,207 |
| 人口密度 | 9.3 / km² | 12.1 / km² | 14.1 / km² | 17.5 / km² | 17.6 / km² |
情報源: JRC (European Commission's Joint Research Centre) の作業 GHS built-up grid
Buffalo Narrowsの2000年から2015年までの人口変化
2000年から2015年にかけて24.3%増加
| 場所 | 1975年以降の変化 | 1990年以降の変化 | 2000年以降の変化 |
|---|---|---|---|
| Buffalo Narrows | +88.5% | +44.6% | +24.3% |
| サスカチュワン州 | +68.7% | +35.9% | +19.9% |
| カナダ | +55.8% | +30.2% | +17.2% |
情報源: JRC (European Commission's Joint Research Centre) の作業 GHS built-up grid
Buffalo Narrowsの年齢中央値
年齢中央値: 27.8歳
| 場所 | 平均年齢 | 年齢の中央値(女性) | 年齢の中央値(男性) |
|---|---|---|---|
| Buffalo Narrows | 27.8 yrs | 30 yrs | 25.9 yrs |
| サスカチュワン州 | 38.4 yrs | 39.4 yrs | 37.3 yrs |
| カナダ | 40.6 yrs | 41.5 yrs | 39.6 yrs |
情報源: CIESIN (Center for International Earth Science Information Network)
Buffalo Narrowsの人口密度
人口密度: 17.6 / km²
| 場所 | 人口 | エリア | 密度 |
|---|---|---|---|
| Buffalo Narrows | 1,207 | 68.5 km² | 17.6 / km² |
| サスカチュワン州 | 1.1 million | 652,352.6 km² | 1.7 / km² |
| カナダ | 35.5 million | 9,875,295.4 km² | 3.6 / km² |
情報源: JRC (European Commission's Joint Research Centre) の作業 GHS built-up grid
Buffalo Narrowsの過去および予測人口
1710年から2100年までの推定人口
情報源:
- JRC (European Commission's Joint Research Centre) の作業 GHS built-up grid
- CIESIN (Center for International Earth Science Information Network)
- [リンク] Klein Goldewijk, K., Beusen, A., Doelman, J., and Stehfest, E.: Anthropogenic land use estimates for the Holocene – HYDE 3.2, Earth Syst. Sci. Data, 9, 927–953, https://doi.org/10.5194/essd-9-927-2017, 2017.
人間開発指数(HDI)
平均余命、教育、および一人当たり収入の統計的複合指数。
出典: [リンク] Kummu, M., Taka, M. &Guillaume, J. 1990年から2015年までのGDPおよび人間開発指数のグローバルグリッドデータセット. Sci Data 5, 180004 (2018) doi:10.1038/sdata.2018.4
Buffalo NarrowsのCO2排出量
1人あたりの二酸化炭素(CO2)排出量(年間トン)
| 場所 | CO2排出量 | 一人当たりのCO2排出量 | CO2排出強度 |
|---|---|---|---|
| Buffalo Narrows | 14,960 tn | 12.39 tn | 218.4 tons/km² |
| サスカチュワン州 | 14,964,194 tn | 13.41 tn | 22.9 tons/km² |
| カナダ | 521,999,336 tn | 14.7 tn | 52.9 tons/km² |
情報源: [リンク] Moran, D., Kanemoto K; Jiborn, M., Wood, R., Többen, J., and Seto, K.C. (2018) 13,000都市のカーボンフットプリント. Environmental Research Letters DOI: 10.1088/1748-9326/aac72a
Buffalo NarrowsのCO2排出量
| 2013年のCO2排出量(トン/年) | 14,960 tn |
| 2013年の一人当たりCO2排出量(トン/年) | 12.39 tn |
| 2013年のCO2排出強度(トン/km²/年) | 218.4 tons/km² |
自然災害リスク
Relative risk out of 10
| ハザード | Risk Level |
|---|---|
| Drought | Low (2) |
* Risk, particularly concerning flood or landslide, may not be for the entire area.
情報源:
- Dilley, M., R.S. Chen, U. Deichmann, A.L. Lerner-Lam, M. Arnold, J. Agwe, P. Buys, O. Kjekstad, B. Lyon, and G. Yetman. 2005. Natural Disaster Hotspots: A Global Risk Analysis. Washington, D.C.: World Bank. https://doi.org/10.1596/0-8213-5930-4.
- Center for Hazards and Risk Research - CHRR - Columbia University, Center for International Earth Science Information Network - CIESIN - Columbia University, and International Research Institute for Climate and Society - IRI - Columbia University. 2005. Global Drought Hazard Frequency and Distribution. Palisades, NY: NASA Socioeconomic Data and Applications Center (SEDAC). https://doi.org/10.7927/H4VX0DFT.

データについて
このページのデータは、公開されている各種ツールやリソースを用いて推定されています。保証なしで提供されており、不正確な情報が含まれる可能性があります。ご自身の責任でご利用ください。