- 世界
- »
- GB
- »
- イングランド
- »
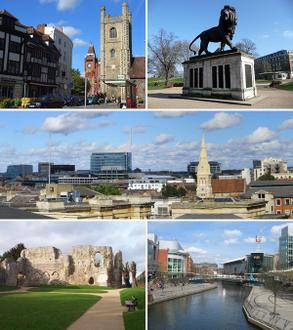
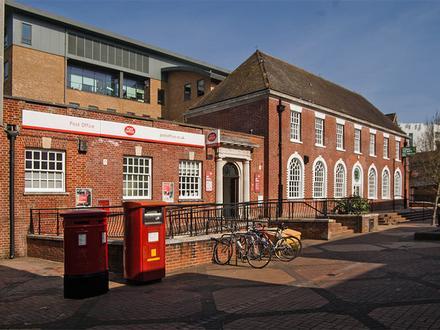
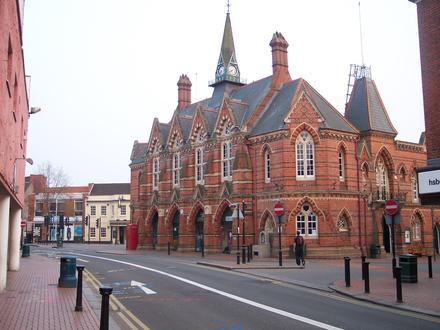
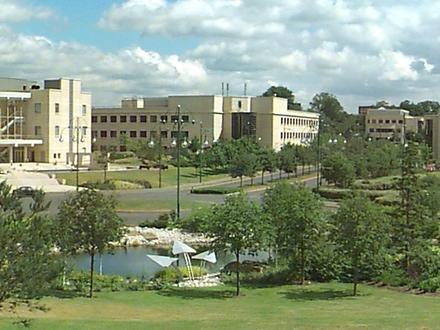
- Crowthorne、 イングランド
Crowthorneのビジネス
産業
産業別事業分布 専門家のサービス: 20.5%
ショッピング: 17.9%
ホームサービス: 11.8%
産業: 8.9%
医療: 6.7%
その他: 34.3%
| 業界の説明 | 事業所数 | ビジネスの平均年齢 | Googleの平均評価 | 住民1,000人あたりのビジネス |
|---|---|---|---|---|
| 車の修理 | 6 | 4.6 | 0.8 | |
| ヘアサロン | 16 | 4.6 | 2.2 | |
| 美容院 | 17 | 4.4 | 2.3 | |
| 政府機関 | 6 | 4.2 | 0.8 | |
| 社会福祉 | 10 | 5.0 | 1.4 | |
| 保育園・幼稚園 | 7 | 3.7 | 1.0 | |
| ローン会社 | 13 | 4.4 | 1.8 | |
| 食料雑貨品店・スーパーマーケット | 13 | 3.9 | 1.8 | |
| ゼネコン | 24 | 4.6 | 3.3 | |
| 不動産 | 8 | 4.5 | 1.1 | |
| 配管設置・修理 | 6 | 5.0 | 0.8 | |
| 電気設備 | 9 | 4.8 | 1.2 | |
| その他の会員組織 | 10 | 4.4 | 1.4 | |
| 建物の建設 | 9 | 3.0 | 1.2 | |
| 代替医療 | 12 | 4.9 | 1.6 | |
| 保健医療 | 47 | 3.3 | 6.4 | |
| 病院 | 6 | 3.7 | 0.8 | |
| 企業マネジメント | 12 | 27.2 年 | 5.0 | 1.6 |
| 経理 | 12 | 5.0 | 1.6 | |
| 教会 | 7 | 4.4 | 1.0 | |
| ショッピングその他 | 20 | 4.0 | 2.7 | |
| 事務用品・文房具店 | 6 | 5.0 | 0.8 | |
| 家電製品・グッズ | 10 | 5.0 | 1.4 | |
| 薬局・ドラッグストア | 8 | 4.3 | 1.1 | |
| 金物店/ホームセンター | 10 | 4.9 | 1.4 | |
| 電気店 | 23 | 33.2 年 | 4.7 | 3.1 |
| Crowthorne、 イングランドの面積 | 13 km² |
| 人口 | 7315 |
| 男性人口 | 3694 (50.5%) |
| 女性人口 | 3621 (49.5%) |
| 1975から2015にかけての人口の変動 | -0.1% |
| 2000から2015にかけての人口の変動 | +4% |
| 平均年齢 | 39.5 |
| 男性平均年齢 | 37.8 |
| 女性の平均年齢 | 41.2 |
| 地域 | Crowthorne, Finchampstead |
| 現地時間 | 木曜日 13:46 |
| 時間帯 | 英国夏時間 |
| 緯度と経度 | 51.37027° / -0.79219° |
| 郵便番号 | RG11, RG12, RG40, RG45 |
Crowthorne、 イングランド - 地図
Crowthorne、 イングランドの人口
1975年から2015年まで| データ | 1975 | 1990 | 2000 | 2015 |
|---|---|---|---|---|
| 人口 | 7324 | 7065 | 7033 | 7315 |
| 人口密度 | 561.5 / km² | 541.6 / km² | 539.2 / km² | 560.8 / km² |
2000から2015にかけてのCrowthorneの人口変動
2000年から2015年にかけての4%の増加| 場所 | 1975以来の変化 | 1990以来の変化 | 2000以来の変化 |
|---|---|---|---|
| Crowthorne、 イングランド | -0.1% | +3.5% | +4% |
| ブラックネル・フォレスト | -0.7% | +2.8% | +3.5% |
| イギリス | +15.2% | +13.3% | +9.9% |
Crowthorne、 イングランドの年齢中央値
年齢中央値:39.5 年| 場所 | 平均年齢 | 年齢の中央値(女性) | 年齢の中央値(男性) |
|---|---|---|---|
| Crowthorne、 イングランド | 39.5 年 | 41.2 年 | 37.8 年 |
| ブラックネル・フォレスト | 38 年 | 38.6 年 | 37.4 年 |
| イギリス | 39.6 年 | 40.6 年 | 38.5 年 |
Crowthorne、 イングランドの人口ピラミッド
年齢と性別による人口| 年齢 | 男性 | 女性 | 合計 |
|---|---|---|---|
| 5歳未満 | 201 | 187 | 388 |
| 5-9 | 238 | 190 | 428 |
| 10-14 | 288 | 270 | 559 |
| 15-19 | 416 | 310 | 726 |
| 20-24 | 170 | 166 | 337 |
| 25-29 | 191 | 162 | 353 |
| 30-34 | 206 | 206 | 412 |
| 35-39 | 245 | 246 | 491 |
| 40-44 | 291 | 310 | 601 |
| 45-49 | 293 | 281 | 575 |
| 50-54 | 236 | 240 | 476 |
| 55-59 | 225 | 222 | 447 |
| 60-64 | 216 | 228 | 445 |
| 65-69 | 153 | 169 | 322 |
| 70-74 | 125 | 143 | 269 |
| 75-79 | 98 | 98 | 197 |
| 80-84 | 50 | 81 | 131 |
| 85プラス | 51 | 114 | 166 |
Crowthorne、 イングランドの人口密度
人口密度:560.8 / km²| 場所 | 人口 | エリア | 人口密度 |
|---|---|---|---|
| Crowthorne、 イングランド | 7315 | 13 km² | 560.8 / km² |
| ブラックネル・フォレスト | 113873 | 109.4 km² | 1040 / km² |
| イギリス | 64.5 ミリオン | 247,916.6 km² | 260.3 / km² |
Crowthorne、 イングランドの予測人口
1975から2100にかけての推定人口Sources:
1. JRC (European Commission's Joint Research Centre) work on the GHS built-up grid
2. CIESIN (Center for International Earth Science Information Network)
3. [リンク] Klein Goldewijk, K., Beusen, A., Doelman, J., and Stehfest, E.: Anthropogenic land use estimates for the Holocene – HYDE 3.2, Earth Syst. Sci. Data, 9, 927–953, https://doi.org/10.5194/essd-9-927-2017, 2017.
市外局番
Crowthorneのビジネスによって使用されている市外局番の割合 市外局番 1344: 73.7%
市外局番 77: 7.3%
市外局番 78: 4.8%
その他: 14.2%
Crowthorne、 イングランドの価格によるビジネスの分布
安価な: 63.3%
適度な: 33.3%
非常に高価な: 3.3%
人間開発指数(HDI)
平均余命、教育、および一人当たり収入の統計的複合指数。Sources: [Link] Kummu, M., Taka, M. & Guillaume, J. Gridded global datasets for Gross Domestic Product and Human Development Index over 1990–2015. Sci Data 5, 180004 (2018) doi:10.1038/sdata.2018.4
Crowthorne、 イングランドの二酸化炭素排出量
1人あたりの二酸化炭素(CO2)排出量(年間トン)| 場所 | CO2排出量 | 一人当たりのCO2排出量 | CO2排出強度 |
|---|---|---|---|
| Crowthorne、 イングランド | 93,827 s/t | 12.8 s/t | 7,193 米トン/km² |
| ブラックネル・フォレスト | 1,454,354 s/t | 12.8 s/t | 13,292 米トン/km² |
| イギリス | 735,672,543 s/t | 11.4 s/t | 2,967 米トン/km² |
Crowthorne、 イングランドの二酸化炭素排出量
| 2013年の二酸化炭素排出量 (トン/年) | 93,827 s/t |
| 2013の人口1人あたりの二酸化炭素排出量 (トン/年) | 12.8 s/t |
| 2013年の二酸化炭素排出量強度 (トン/km²/年) | 7,193 米トン/km² |
自然災害リスク
10のうちの相対リスク| 洪水 | 高 (10) |
*特に洪水または地滑りに関するリスクは、地域全体に及ぶとは限りません。
Sources: 1. Dilley, M., R.S. Chen, U. Deichmann, A.L. Lerner-Lam, M. Arnold, J. Agwe, P. Buys, O. Kjekstad, B. Lyon, and G. Yetman. 2005. Natural Disaster Hotspots: A Global Risk Analysis. Washington, D.C.: World Bank. https://doi.org/10.1596/0-8213-5930-4.
2. Center for Hazards and Risk Research - CHRR - Columbia University, Center for International Earth Science Information Network - CIESIN - Columbia University. 2005. Global Flood Hazard Frequency and Distribution. Palisades, NY: NASA Socioeconomic Data and Applications Center (SEDAC). https://doi.org/10.7927/H4668B3D.
最近の近くの地震
マグニチュード3.0以上| 日付 | 時間 | 大きさ | 距離 | 深さ | 場所 | リンク |
|---|---|---|---|---|---|---|
| 2019/02/26 | 19:42 | 3.3 | 38.8 km | 10,000 m | 3km SE of Dorking, United Kingdom | usgs.gov |
| 1995/09/09 | 11:20 | 3.3 | 66.8 km | 10,000 m | England, United Kingdom | usgs.gov |
| 1994/05/11 | 18:08 | 3.7 | 92.6 km | 10,000 m | England, United Kingdom | usgs.gov |
| 1986/12/26 | 12:50 | 3.4 | 66.9 km | 10,000 m | England, United Kingdom | usgs.gov |
| 1985/12/02 | 9:40 | 3.3 | 23 km | 13,000 m | England, United Kingdom | usgs.gov |
データについて
このページのデータは、公開されている多くのツールとリソースを使用して推定されています。保証なしで提供され、不正確な内容が含まれている可能性があります。自己責任。詳細については、 こちらをご覧ください。