Amarnāthのカテゴリー
オートバイの修理ガソリンスタンド車の修理プラスチック・化学品・石油製品の製造卸売業者産業用機器製造業者製薬会社輸出入会社鉄鋼加工業者女性用衣料履物服屋男性用衣料靴店携帯電話ショップNPO法人コミュニティ センターヒンズー教の寺院政府機関IT コンサルタントソフトウェア企業電器店電子機器修理店電気修理店エンジニアリング コンサルタントホームセンター住宅開発建物の建設建築請負業者コーチングセンタープリスクール一般教育学校公立学校各種学校小学校教育教育センター教育機関職業・専門訓練高校Makeup Artistデザイン代理店写真スタジオ写真家観光名所アイスクリーム店インド料理レストランカフェケーキ屋ケータリング
1-50/117表示
産業
Amarnāthにおける業界別ビジネス分布
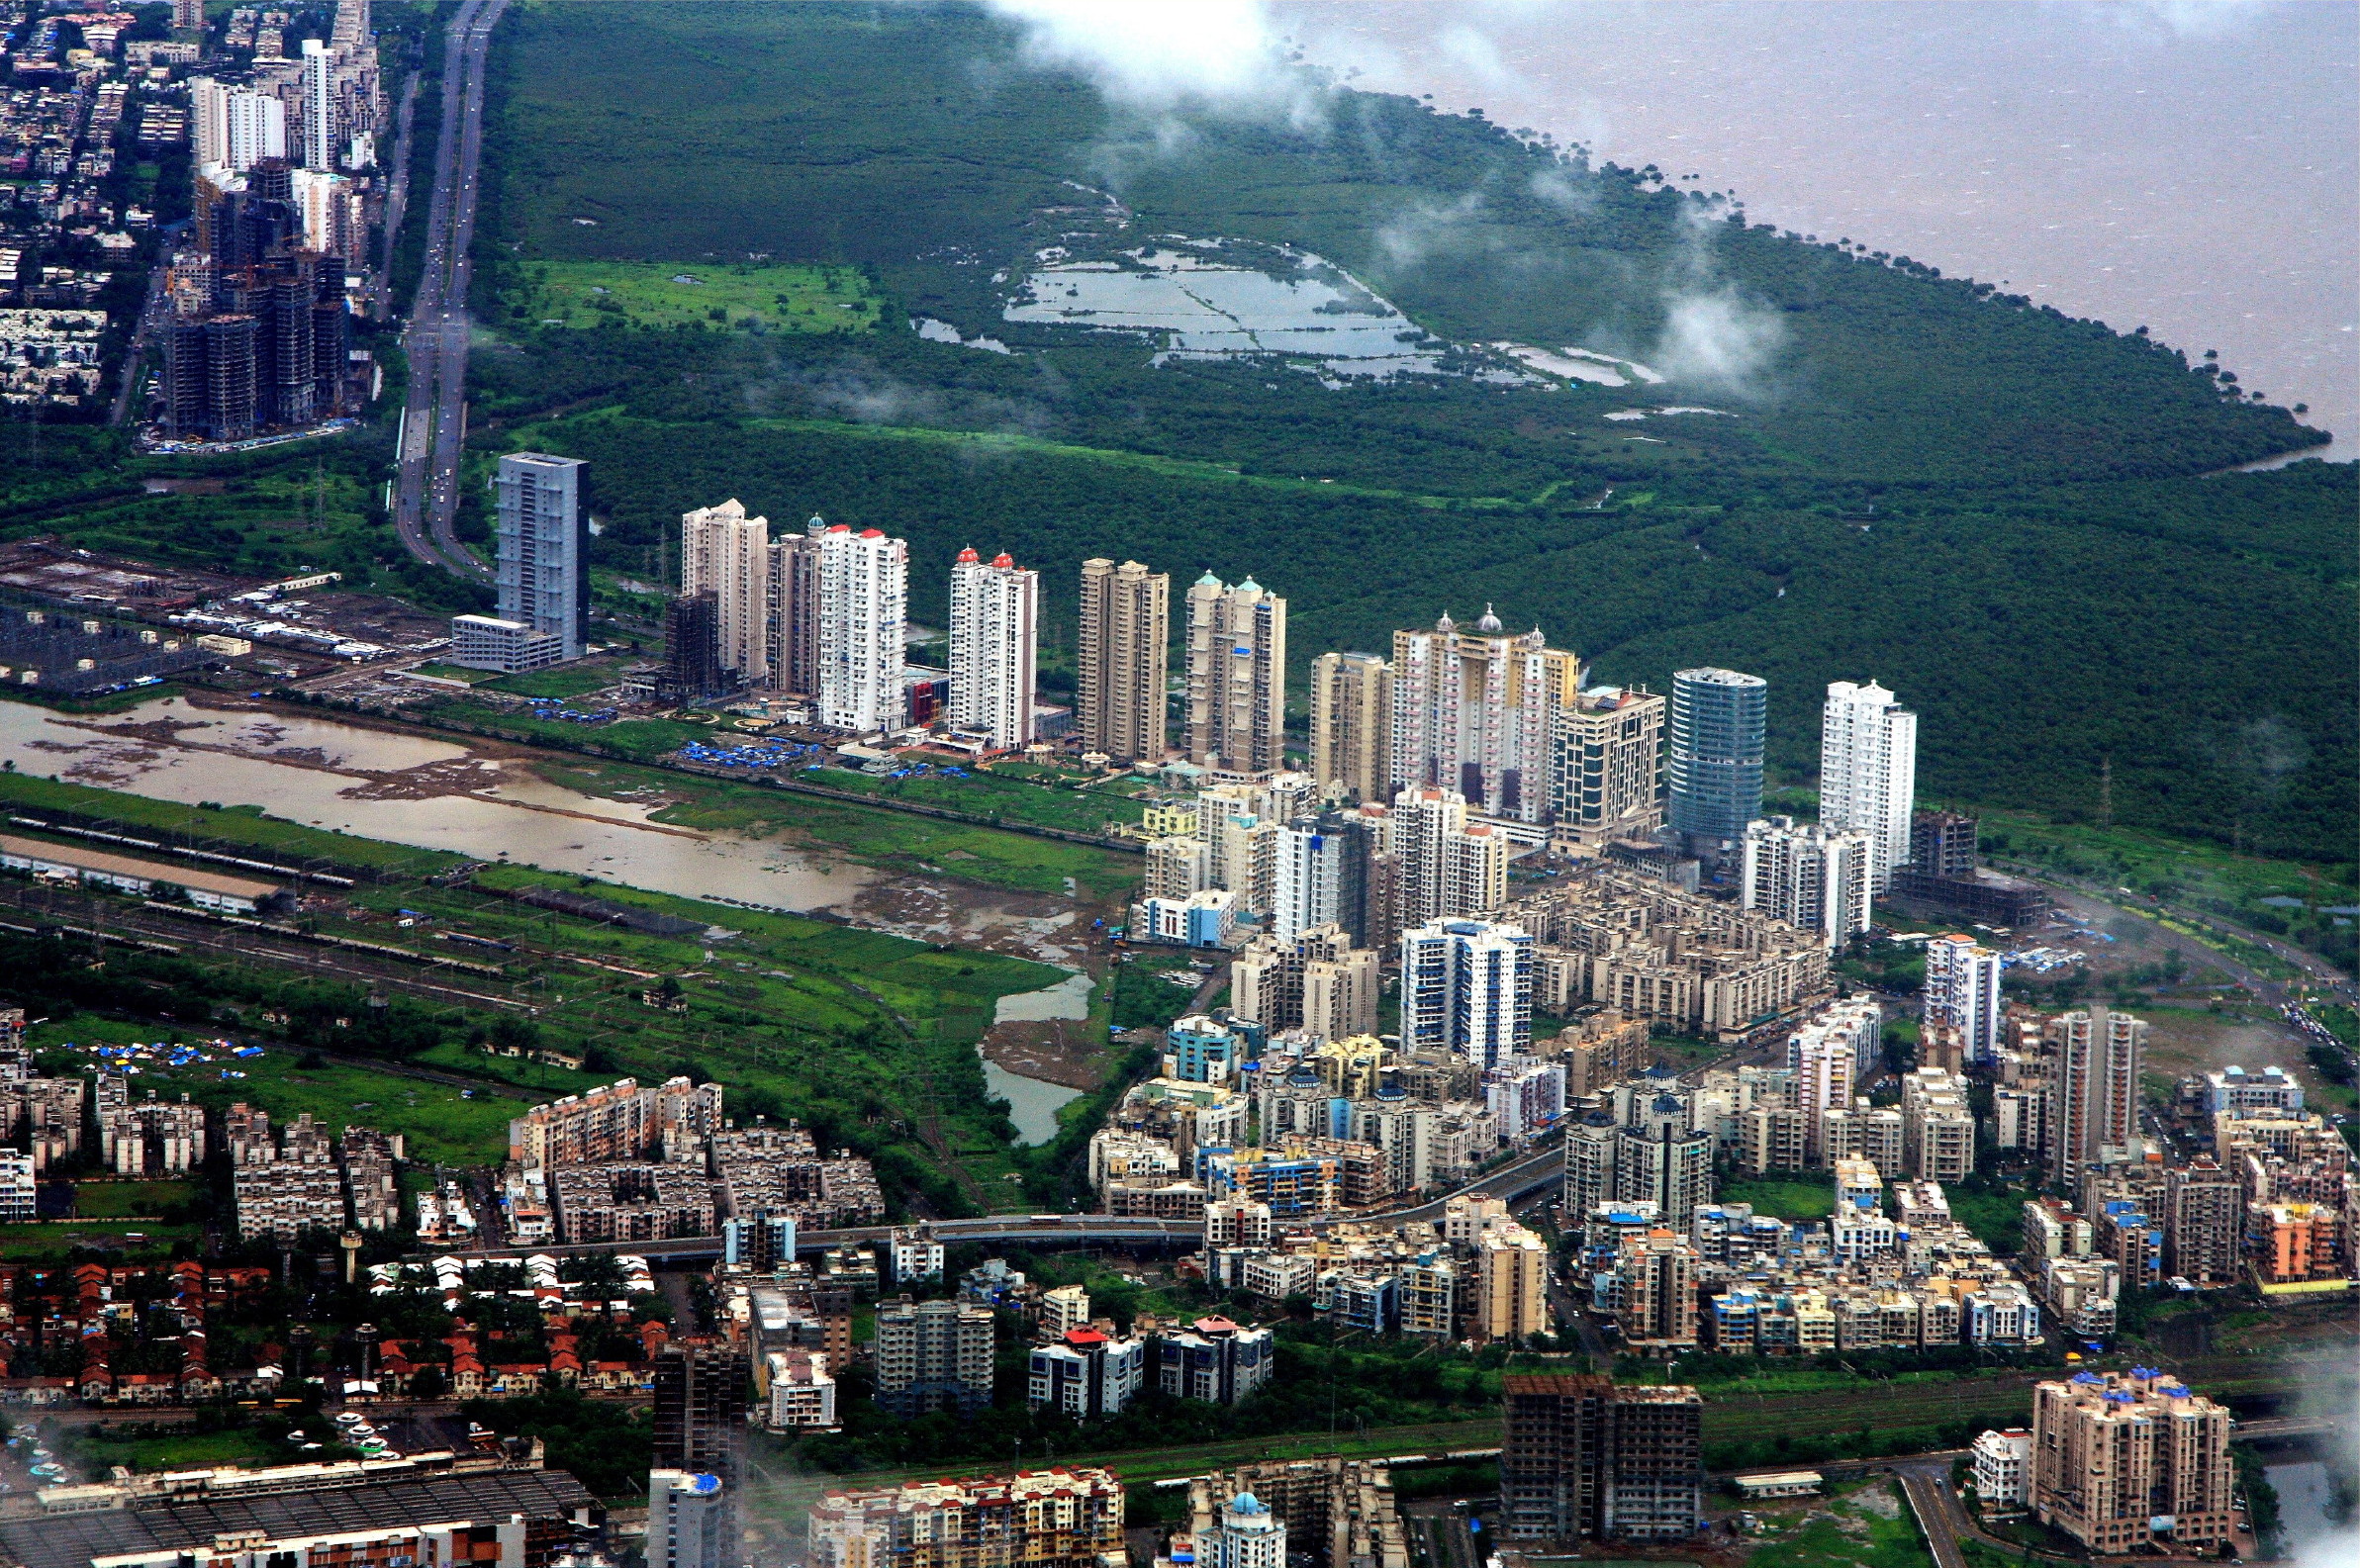
Amarnāthの地図
インタラクティブマップ
Amarnāthの人口
1975年から2030年
| Data | 1975 | 1990 | 2000 | 2015 | 2020 | 2025* | 2030* |
|---|---|---|---|---|---|---|---|
| 人口 | 61,227 | 109,966 | 152,258 | 228,446 | 215,812 | 229,661 | 253,825 |
| 人口密度 | 7,713.6 / km² | 13,854 / km² | 19,182.1 / km² | 28,780.6 / km² | 27,188.9 / km² | 28,933.7 / km² | 31,978 / km² |
* 予測値
情報源: JRC (European Commission's Joint Research Centre) の作業 GHS built-up gridAmarnāthの2000年から2020年までの人口変化
2000年から2020年にかけて41.7%増加
| 場所 | 1975年以降の変化 | 1990年以降の変化 | 2000年以降の変化 |
|---|---|---|---|
| Amarnāth | +252.5% | +96.3% | +41.7% |
| マハーラーシュトラ州 | — | — | — |
| インド | — | — | — |
情報源: JRC (European Commission's Joint Research Centre) の作業 GHS built-up grid
Amarnāthの年齢中央値
年齢中央値: 27.1歳
| 場所 | 平均年齢 | 年齢の中央値(女性) | 年齢の中央値(男性) |
|---|---|---|---|
| Amarnāth | 27.1 yrs | 27 yrs | 27.1 yrs |
| マハーラーシュトラ州 | 27.2 yrs | 27.8 yrs | 26.6 yrs |
| インド | 24.9 yrs | 25.4 yrs | 24.5 yrs |
情報源: CIESIN (Center for International Earth Science Information Network)
Amarnāthの人口密度
人口密度: 27,189 / km²
| 場所 | 人口 | エリア | 密度 |
|---|---|---|---|
| Amarnāth | 215,812 | 7.9 km² | 27,189 / km² |
| マハーラーシュトラ州 | 120.6 million | 307,683.7 km² | 392 / km² |
| インド | 1,307 million | 3,083,563.4 km² | 424 / km² |
情報源: JRC (European Commission's Joint Research Centre) の作業 GHS built-up grid
Amarnāthの過去および予測人口
1800年から2100年までの推定人口
情報源:
- JRC (European Commission's Joint Research Centre) の作業 GHS built-up grid
- CIESIN (Center for International Earth Science Information Network)
- [リンク] Klein Goldewijk, K., Beusen, A., Doelman, J., and Stehfest, E.: Anthropogenic land use estimates for the Holocene – HYDE 3.2, Earth Syst. Sci. Data, 9, 927–953, https://doi.org/10.5194/essd-9-927-2017, 2017.
郵便番号
Amarnāthの郵便番号別の企業の割合
価格分布
Amarnāthの価格によるビジネスの分布
人間開発指数(HDI)
平均余命、教育、および一人当たり収入の統計的複合指数。
出典: [リンク] Kummu, M., Taka, M. &Guillaume, J. 1990年から2015年までのGDPおよび人間開発指数のグローバルグリッドデータセット. Sci Data 5, 180004 (2018) doi:10.1038/sdata.2018.4
Amarnāthの国内総生産(GDP)
一人当たりGDP、購買力平価(2017年国際ドル固定)
| Data | 1990 | 1995 | 2000 | 2005 | 2010 | 2015 | 2020 | 2022 |
|---|---|---|---|---|---|---|---|---|
| 一人当たりGDP | $6,329 | $4,758 | $5,825 | $6,477 | $10,288 | $12,130 | $13,028 | $14,781 |
| GDP総額 | $19.5億 | $16.9億 | $24.3億 | $31.4億 | $57.4億 | $74.8億 | $86.1億 | $100.7億 |
出典: [リンク] Kummu, M., Kosonen, M. & Masoumzadeh Sayyar, S. Downscaled gridded global dataset for gross domestic product (GDP) per capita PPP over 1990–2022. Sci Data 12, 178 (2025) doi:10.1038/s41597-025-04487-x
AmarnāthのCO2排出量
1人あたりの二酸化炭素(CO2)排出量(年間トン)
| 場所 | CO2排出量 | 一人当たりのCO2排出量 | CO2排出強度 |
|---|---|---|---|
| Amarnāth | 600,410 tn | 2.78 tn | 75,642.2 tons/km² |
| マハーラーシュトラ州 | 206,036,744 tn | 1.71 tn | 669.6 tons/km² |
| インド | 1,928,568,344 tn | 1.48 tn | 625.4 tons/km² |
情報源: [リンク] Moran, D., Kanemoto K; Jiborn, M., Wood, R., Többen, J., and Seto, K.C. (2018) 13,000都市のカーボンフットプリント. Environmental Research Letters DOI: 10.1088/1748-9326/aac72a
AmarnāthのCO2排出量
| 2013年のCO2排出量(トン/年) | 600,410 tn |
| 2013年の一人当たりCO2排出量(トン/年) | 2.78 tn |
| 2013年のCO2排出強度(トン/km²/年) | 75,642.2 tons/km² |
自然災害リスク
10のうちの相対リスク
| ハザード | リスクレベル |
|---|---|
| 干ばつ | 中 (7) |
| 洪水 | 高 (8) |
| 地震 | 低 (2) |
| 地すべり | 中 (6) |
*特に洪水または地滑りに関するリスクは、地域全体に及ぶとは限りません。
情報源:
- Dilley, M., R.S. Chen, U. Deichmann, A.L. Lerner-Lam, M. Arnold, J. Agwe, P. Buys, O. Kjekstad, B. Lyon, and G. Yetman. 2005. Natural Disaster Hotspots: A Global Risk Analysis. Washington, D.C.: World Bank. https://doi.org/10.1596/0-8213-5930-4.
- Center for Hazards and Risk Research - CHRR - Columbia University, Center for International Earth Science Information Network - CIESIN - Columbia University, and Norwegian Geotechnical Institute - NGI. 2005. Global Landslide Hazard Distribution. Palisades, NY: NASA Socioeconomic Data and Applications Center (SEDAC). https://doi.org/10.7927/H4P848VZ.
- Center for Hazards and Risk Research - CHRR - Columbia University, Center for International Earth Science Information Network - CIESIN - Columbia University, and International Research Institute for Climate and Society - IRI - Columbia University. 2005. Global Drought Hazard Frequency and Distribution. Palisades, NY: NASA Socioeconomic Data and Applications Center (SEDAC). https://doi.org/10.7927/H4VX0DFT.
- Center for Hazards and Risk Research - CHRR - Columbia University, Center for International Earth Science Information Network - CIESIN - Columbia University. 2005. Global Flood Hazard Frequency and Distribution. Palisades, NY: NASA Socioeconomic Data and Applications Center (SEDAC). https://doi.org/10.7927/H4668B3D.
- Center for Hazards and Risk Research - CHRR - Columbia University, Center for International Earth Science Information Network - CIESIN - Columbia University. 2005. Global Earthquake Hazard Distribution - Peak Ground Acceleration. Palisades, NY: NASA Socioeconomic Data and Applications Center (SEDAC). https://doi.org/10.7927/H4BZ63ZS.
最近の近くの地震
マグニチュード3.0以上


データについて
このページのデータは、公開されている各種ツールやリソースを用いて推定されています。保証なしで提供されており、不正確な情報が含まれる可能性があります。ご自身の責任でご利用ください。