Narwarのカテゴリー
オートバイの修理ガソリンスタンドトラクター修理工場バイク ショップ整備士自動車用品ショップ車の修理セメント供給業者農業女性用衣料宝石や時計服屋靴店携帯電話ショップコミュニティ センタージャイナ教寺院ヒンズー教の寺院モスク宗教政府機関聖地コンピューター サポート、サービス携帯電話修理店携帯電話用アクセサリ販売店電器店電子機器修理店ホームセンター住宅の建設住宅開発建物の建設日用品店コーチングセンターホームヘルプ一般教育学校中等教育学校公立学校単科大学大学小学校小学校教育教育センター教育機関自動車教習所高校写真スタジオ写真家インターネットカフェカフェキャンディショップ
1-50/87表示
産業
Narwarにおける業界別ビジネス分布
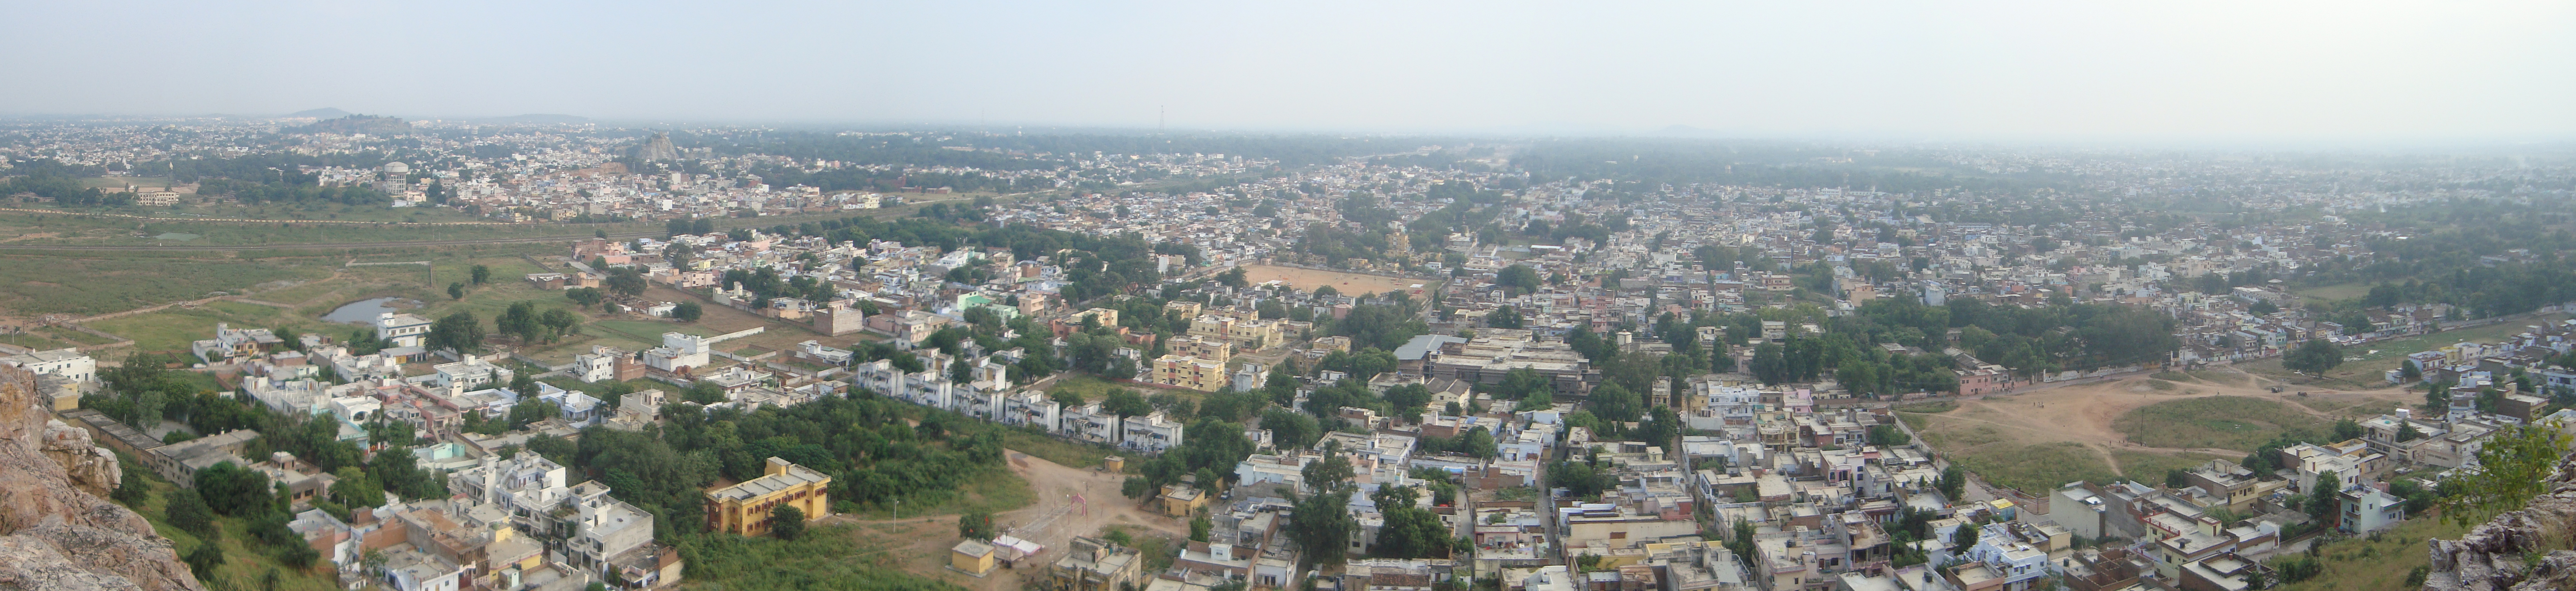
Narwarの地図
インタラクティブマップ
Narwarの人口
1975年から2030年
| Data | 1975 | 1990 | 2000 | 2015 | 2020 | 2025* | 2030* |
|---|---|---|---|---|---|---|---|
| 人口 | 72,613 | 112,341 | 133,775 | 169,960 | 194,669 | 203,227 | 211,090 |
| 人口密度 | 83.8 / km² | 129.6 / km² | 154.3 / km² | 196 / km² | 224.5 / km² | 234.4 / km² | 243.5 / km² |
* 予測値
情報源: JRC (European Commission's Joint Research Centre) の作業 GHS built-up gridNarwarの2000年から2020年までの人口変化
2000年から2020年にかけて45.5%増加
| 場所 | 1975年以降の変化 | 1990年以降の変化 | 2000年以降の変化 |
|---|---|---|---|
| Narwar | +168.1% | +73.3% | +45.5% |
| マディヤ・プラデーシュ州 | — | — | — |
| インド | — | — | — |
情報源: JRC (European Commission's Joint Research Centre) の作業 GHS built-up grid
Narwarの年齢中央値
年齢中央値: 21.8歳
| 場所 | 平均年齢 | 年齢の中央値(女性) | 年齢の中央値(男性) |
|---|---|---|---|
| Narwar | 21.8 yrs | 22 yrs | 21.6 yrs |
| マディヤ・プラデーシュ州 | 23.4 yrs | 23.7 yrs | 23.1 yrs |
| インド | 24.9 yrs | 25.4 yrs | 24.5 yrs |
情報源: CIESIN (Center for International Earth Science Information Network)
Narwarの人口密度
人口密度: 225 / km²
| 場所 | 人口 | エリア | 密度 |
|---|---|---|---|
| Narwar | 194,669 | 867 km² | 225 / km² |
| マディヤ・プラデーシュ州 | 79.1 million | 308,149.6 km² | 257 / km² |
| インド | 1,307 million | 3,083,563.4 km² | 424 / km² |
情報源: JRC (European Commission's Joint Research Centre) の作業 GHS built-up grid
Narwarの過去および予測人口
0年から2100年までの推定人口
情報源:
- JRC (European Commission's Joint Research Centre) の作業 GHS built-up grid
- CIESIN (Center for International Earth Science Information Network)
- [リンク] Klein Goldewijk, K., Beusen, A., Doelman, J., and Stehfest, E.: Anthropogenic land use estimates for the Holocene – HYDE 3.2, Earth Syst. Sci. Data, 9, 927–953, https://doi.org/10.5194/essd-9-927-2017, 2017.
人間開発指数(HDI)
平均余命、教育、および一人当たり収入の統計的複合指数。
出典: [リンク] Kummu, M., Taka, M. &Guillaume, J. 1990年から2015年までのGDPおよび人間開発指数のグローバルグリッドデータセット. Sci Data 5, 180004 (2018) doi:10.1038/sdata.2018.4
Narwarの国内総生産(GDP)
一人当たりGDP、購買力平価(2017年国際ドル固定)
| Data | 1990 | 1995 | 2000 | 2005 | 2010 | 2015 | 2020 | 2022 |
|---|---|---|---|---|---|---|---|---|
| 一人当たりGDP | $1,153 | $1,485 | $1,855 | $2,003 | $2,396 | $3,098 | $3,697 | $4,367 |
| GDP総額 | $1.3億 | $1.8億 | $2.5億 | $3億 | $3.9億 | $5.3億 | $6.4億 | $7.7億 |
出典: [リンク] Kummu, M., Kosonen, M. & Masoumzadeh Sayyar, S. Downscaled gridded global dataset for gross domestic product (GDP) per capita PPP over 1990–2022. Sci Data 12, 178 (2025) doi:10.1038/s41597-025-04487-x
NarwarのCO2排出量
1人あたりの二酸化炭素(CO2)排出量(年間トン)
| 場所 | CO2排出量 | 一人当たりのCO2排出量 | CO2排出強度 |
|---|---|---|---|
| Narwar | 219,526 tn | 1.13 tn | 253.2 tons/km² |
| マディヤ・プラデーシュ州 | 98,758,435 tn | 1.25 tn | 320.5 tons/km² |
| インド | 1,928,568,344 tn | 1.48 tn | 625.4 tons/km² |
情報源: [リンク] Moran, D., Kanemoto K; Jiborn, M., Wood, R., Többen, J., and Seto, K.C. (2018) 13,000都市のカーボンフットプリント. Environmental Research Letters DOI: 10.1088/1748-9326/aac72a
NarwarのCO2排出量
| 2013年のCO2排出量(トン/年) | 219,526 tn |
| 2013年の一人当たりCO2排出量(トン/年) | 1.13 tn |
| 2013年のCO2排出強度(トン/km²/年) | 253.2 tons/km² |
自然災害リスク
10のうちの相対リスク
| ハザード | リスクレベル |
|---|---|
| 干ばつ | 中 (7) |
| 洪水 | 高 (8) |
*特に洪水または地滑りに関するリスクは、地域全体に及ぶとは限りません。
情報源:
- Dilley, M., R.S. Chen, U. Deichmann, A.L. Lerner-Lam, M. Arnold, J. Agwe, P. Buys, O. Kjekstad, B. Lyon, and G. Yetman. 2005. Natural Disaster Hotspots: A Global Risk Analysis. Washington, D.C.: World Bank. https://doi.org/10.1596/0-8213-5930-4.
- Center for Hazards and Risk Research - CHRR - Columbia University, Center for International Earth Science Information Network - CIESIN - Columbia University, and International Research Institute for Climate and Society - IRI - Columbia University. 2005. Global Drought Hazard Frequency and Distribution. Palisades, NY: NASA Socioeconomic Data and Applications Center (SEDAC). https://doi.org/10.7927/H4VX0DFT.
- Center for Hazards and Risk Research - CHRR - Columbia University, Center for International Earth Science Information Network - CIESIN - Columbia University. 2005. Global Flood Hazard Frequency and Distribution. Palisades, NY: NASA Socioeconomic Data and Applications Center (SEDAC). https://doi.org/10.7927/H4668B3D.
最近の近くの地震
マグニチュード3.0以上
| 日付▼ | 時間↕ | Magnitude↕ | Distance↕ | 深さ↕ | 場所↕ | リンク |
|---|---|---|---|---|---|---|
| 8/31/94 | 11:29 PM | 4.7 | 69.4 km | 33,000 m | Uttar Pradesh-Madhya Pradesh border region, India | usgs.gov |


データについて
このページのデータは、公開されている各種ツールやリソースを用いて推定されています。保証なしで提供されており、不正確な情報が含まれる可能性があります。ご自身の責任でご利用ください。