産業
Marteにおける業界別ビジネス分布
| 業界の説明 | 事業所数 |
|---|---|
| 小学校 | 18 |
Marteのデータ
| エリア | 0.3 km² |
| 人口 | 9,368 |
| 男性人口 | 4,906 (52.4%) |
| 女性人口 | 4,462 (47.6%) |
| 人口変化 (2000 to 2020) | +936700.0% |
| 平均年齢 | 16.8歳 (男性: 16.5, 女性: 17) |
| 現地時間 | |
| 時間帯 | 西アフリカ時間 |
| 緯度と経度 | 12.36532, 13.82930 |
| 郵便番号 | 611105 |
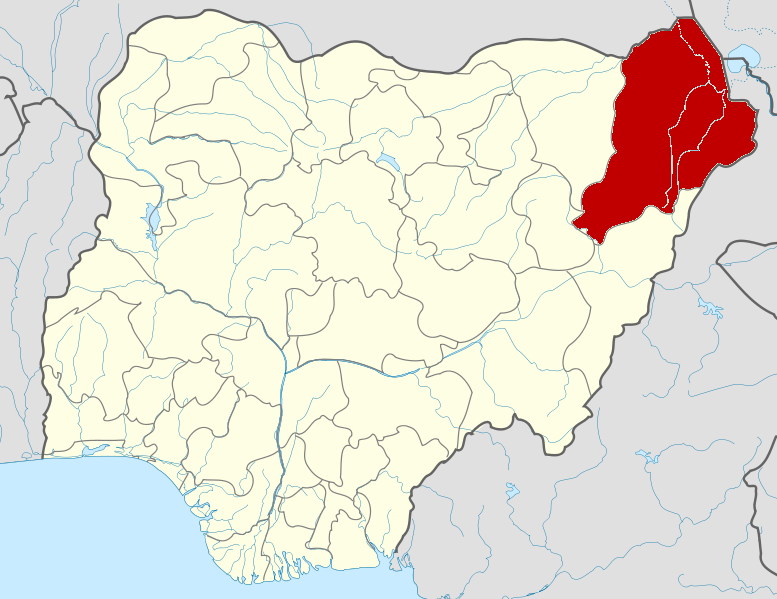
Marteの地図
インタラクティブマップ
Marteの人口
1975年から2030年
| Data | 1975 | 1990 | 2000 | 2015 | 2020 | 2025* | 2030* |
|---|---|---|---|---|---|---|---|
| 人口 | 0 | 0 | 1 | 2 | 9,368 | 10,067 | 10,991 |
| 人口密度 | 0 / km² | 0 / km² | 3.2 / km² | 6.4 / km² | 29,977.6 / km² | 32,214.4 / km² | 35,171.2 / km² |
* 予測値
情報源: JRC (European Commission's Joint Research Centre) の作業 GHS built-up gridMarteの2000年から2020年までの人口変化
2000年から2020年にかけて936700%増加
| 場所 | 1975年以降の変化 | 1990年以降の変化 | 2000年以降の変化 |
|---|---|---|---|
| Marte | — | — | +936700% |
| ボルノ州 | — | — | — |
| ナイジェリア | — | — | — |
情報源: JRC (European Commission's Joint Research Centre) の作業 GHS built-up grid
Marteの年齢中央値
年齢中央値: 16.8歳
| 場所 | 平均年齢 | 年齢の中央値(女性) | 年齢の中央値(男性) |
|---|---|---|---|
| Marte | 16.8 yrs | 17 yrs | 16.5 yrs |
| ボルノ州 | 16.9 yrs | 17.3 yrs | 16.4 yrs |
| ナイジェリア | 18.9 yrs | 19.3 yrs | 18.5 yrs |
情報源: CIESIN (Center for International Earth Science Information Network)
Marteの人口密度
人口密度: 29,978 / km²
| 場所 | 人口 | エリア | 密度 |
|---|---|---|---|
| Marte | 9,368 | 0.313 km² | 29,978 / km² |
| ボルノ州 | 5.5 million | 72,299.9 km² | 75.6 / km² |
| ナイジェリア | 182 million | 909,042.9 km² | 200 / km² |
情報源: JRC (European Commission's Joint Research Centre) の作業 GHS built-up grid
Marteの過去および予測人口
1975年から2100年までの推定人口
情報源:
- JRC (European Commission's Joint Research Centre) の作業 GHS built-up grid
- CIESIN (Center for International Earth Science Information Network)
- [リンク] Klein Goldewijk, K., Beusen, A., Doelman, J., and Stehfest, E.: Anthropogenic land use estimates for the Holocene – HYDE 3.2, Earth Syst. Sci. Data, 9, 927–953, https://doi.org/10.5194/essd-9-927-2017, 2017.
人間開発指数(HDI)
平均余命、教育、および一人当たり収入の統計的複合指数。
出典: [リンク] Kummu, M., Taka, M. &Guillaume, J. 1990年から2015年までのGDPおよび人間開発指数のグローバルグリッドデータセット. Sci Data 5, 180004 (2018) doi:10.1038/sdata.2018.4
MarteのCO2排出量
1人あたりの二酸化炭素(CO2)排出量(年間トン)
| 場所 | CO2排出量 | 一人当たりのCO2排出量 | CO2排出強度 |
|---|---|---|---|
| Marte | 3,768 tn | 0.4 tn | 12,058.9 tons/km² |
| ボルノ州 | 2,199,965 tn | 0.4 tn | 30.4 tons/km² |
| ナイジェリア | 86,705,254 tn | 0.48 tn | 95.4 tons/km² |
情報源: [リンク] Moran, D., Kanemoto K; Jiborn, M., Wood, R., Többen, J., and Seto, K.C. (2018) 13,000都市のカーボンフットプリント. Environmental Research Letters DOI: 10.1088/1748-9326/aac72a
MarteのCO2排出量
| 2013年のCO2排出量(トン/年) | 3,768 tn |
| 2013年の一人当たりCO2排出量(トン/年) | 0.4 tn |
| 2013年のCO2排出強度(トン/km²/年) | 12,058.9 tons/km² |
自然災害リスク
10のうちの相対リスク
| ハザード | リスクレベル |
|---|---|
| 干ばつ | 低 (2) |
| 洪水 | 中 (4) |
*特に洪水または地滑りに関するリスクは、地域全体に及ぶとは限りません。
情報源:
- Dilley, M., R.S. Chen, U. Deichmann, A.L. Lerner-Lam, M. Arnold, J. Agwe, P. Buys, O. Kjekstad, B. Lyon, and G. Yetman. 2005. Natural Disaster Hotspots: A Global Risk Analysis. Washington, D.C.: World Bank. https://doi.org/10.1596/0-8213-5930-4.
- Center for Hazards and Risk Research - CHRR - Columbia University, Center for International Earth Science Information Network - CIESIN - Columbia University, and International Research Institute for Climate and Society - IRI - Columbia University. 2005. Global Drought Hazard Frequency and Distribution. Palisades, NY: NASA Socioeconomic Data and Applications Center (SEDAC). https://doi.org/10.7927/H4VX0DFT.
- Center for Hazards and Risk Research - CHRR - Columbia University, Center for International Earth Science Information Network - CIESIN - Columbia University. 2005. Global Flood Hazard Frequency and Distribution. Palisades, NY: NASA Socioeconomic Data and Applications Center (SEDAC). https://doi.org/10.7927/H4668B3D.

データについて
このページのデータは、公開されている各種ツールやリソースを用いて推定されています。保証なしで提供されており、不正確な情報が含まれる可能性があります。ご自身の責任でご利用ください。