産業
Kollumにおける業界別ビジネス分布
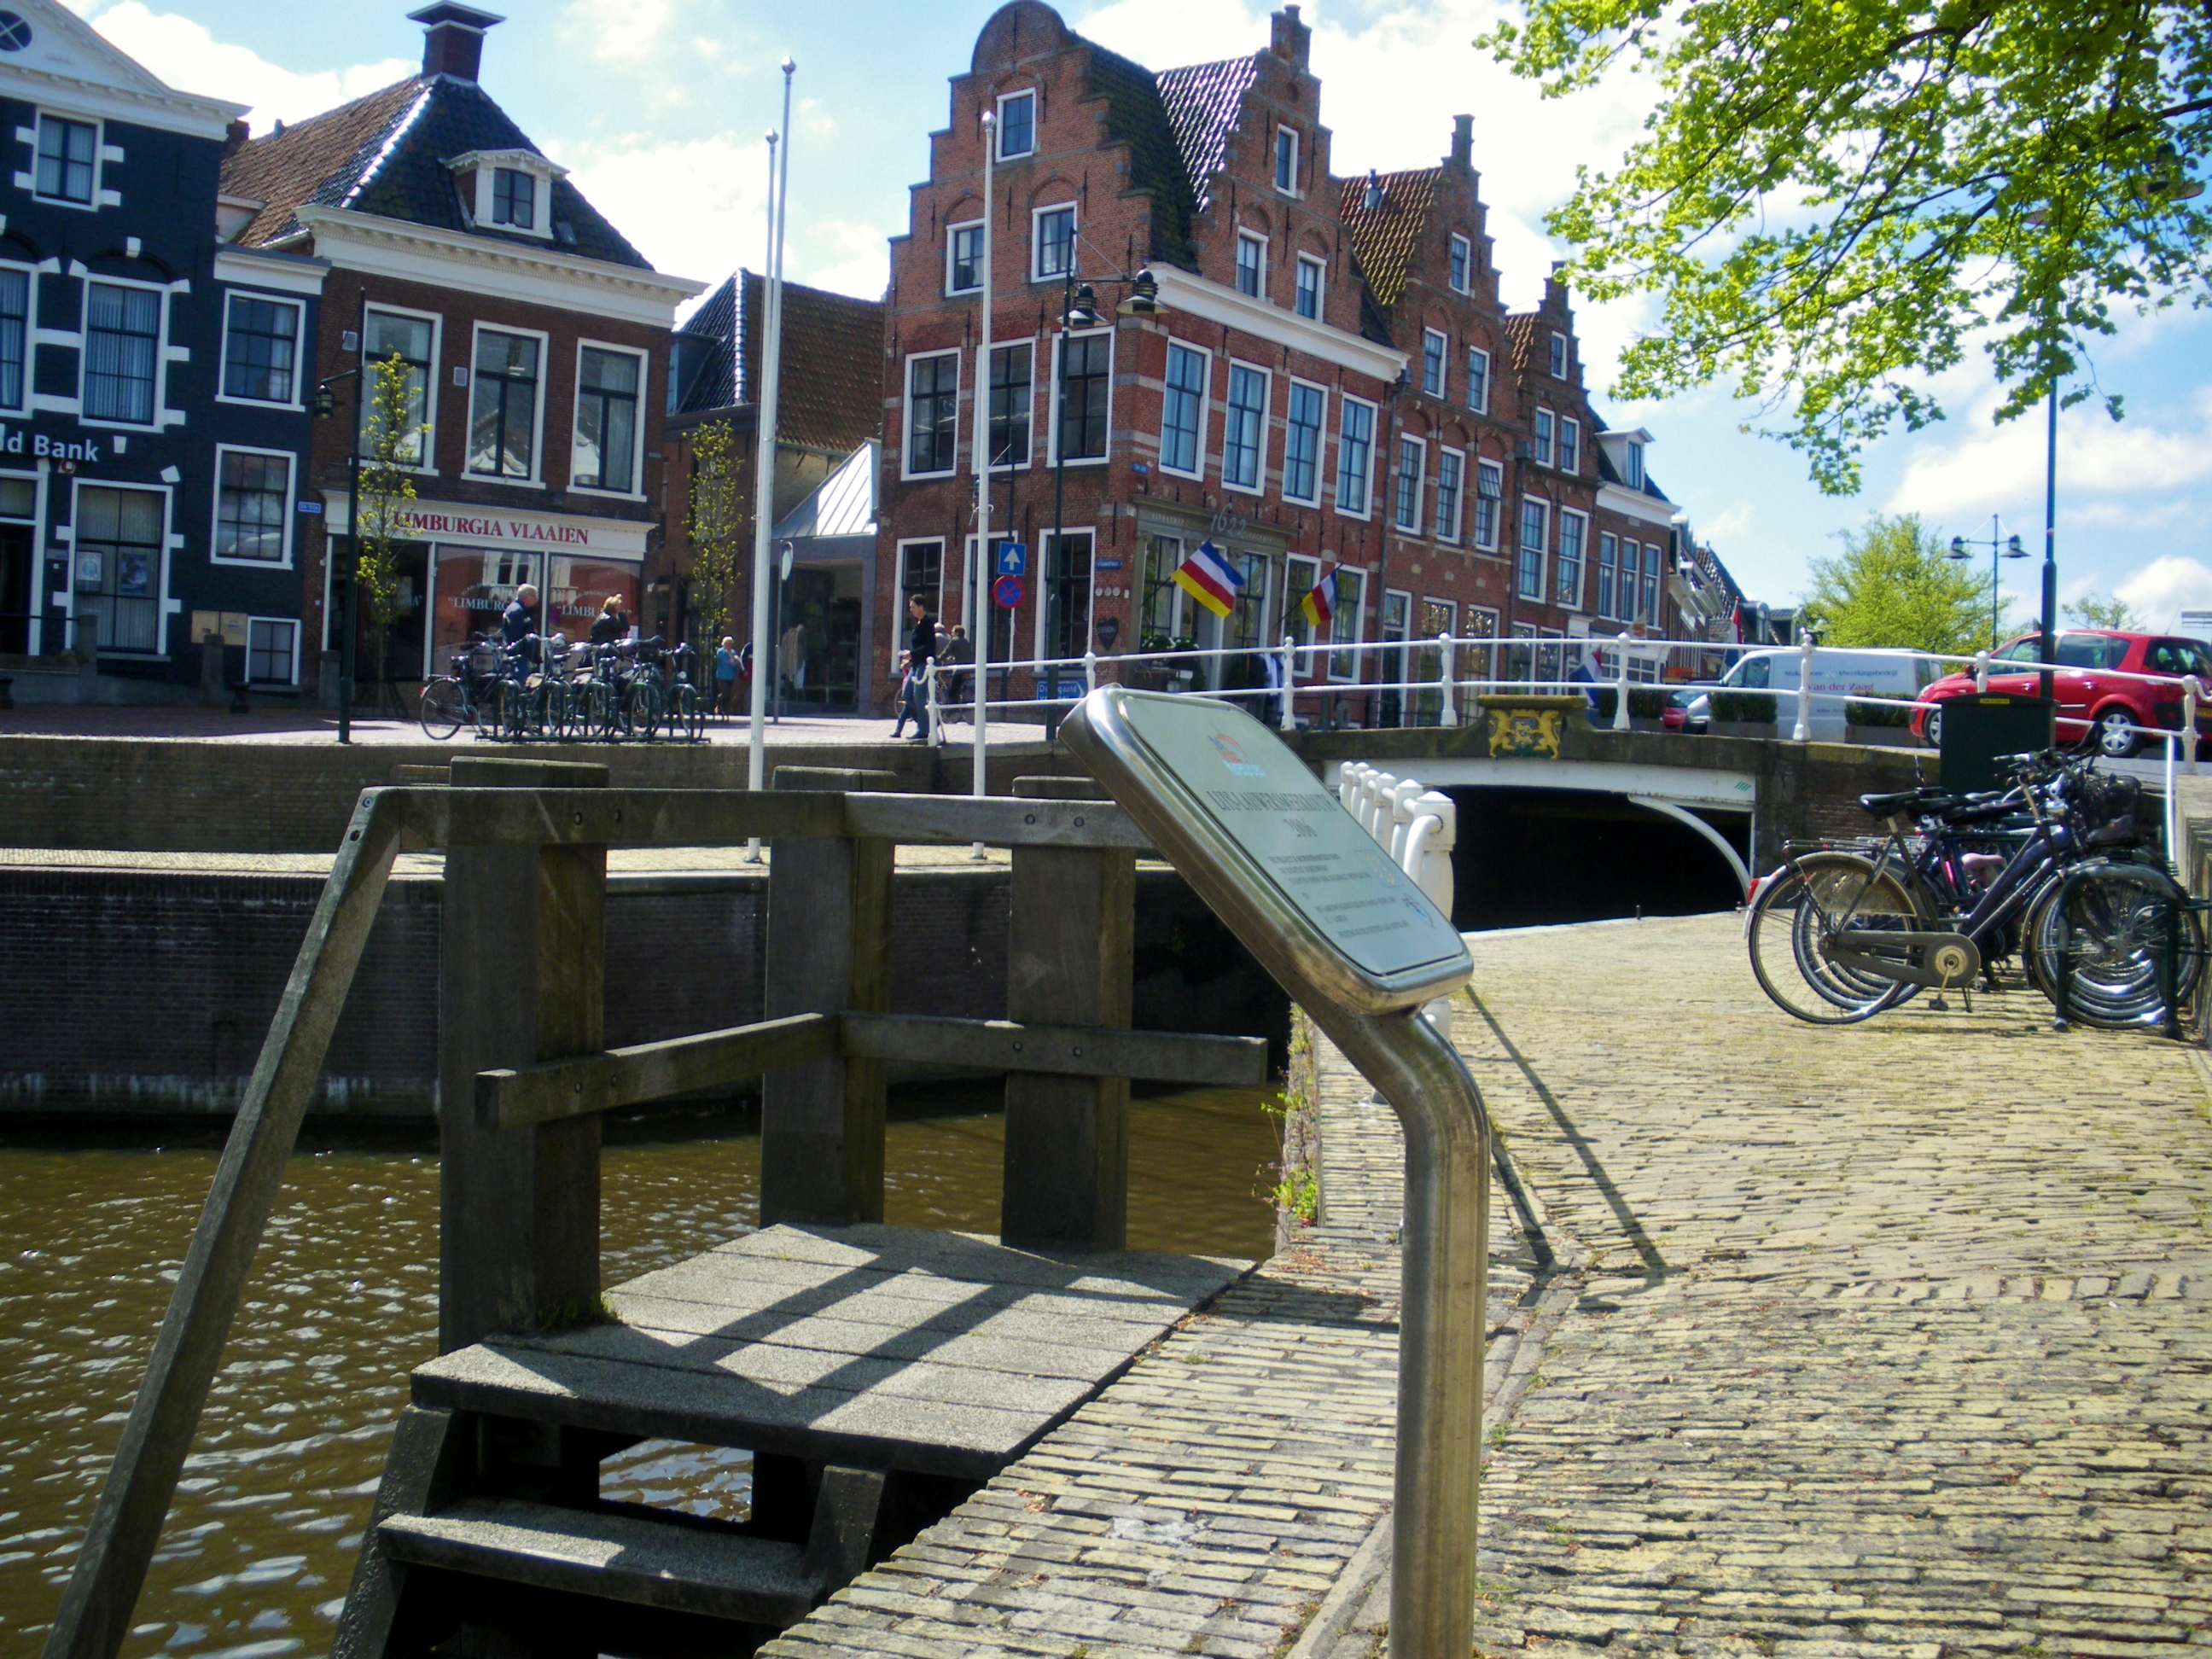
Kollumの地図
インタラクティブマップ
Kollumの人口
1975年から2030年
| Data | 1975 | 1990 | 2000 | 2015 | 2020 | 2025* | 2030* |
|---|---|---|---|---|---|---|---|
| 人口 | 5,103 | 4,737 | 4,731 | 4,479 | 5,600 | 5,470 | 5,367 |
| 人口密度 | 340.2 / km² | 315.8 / km² | 315.4 / km² | 298.6 / km² | 373.3 / km² | 364.7 / km² | 357.8 / km² |
* 予測値
情報源: JRC (European Commission's Joint Research Centre) の作業 GHS built-up gridKollumの2000年から2020年までの人口変化
2000年から2020年にかけて18.4%増加
| 場所 | 1975年以降の変化 | 1990年以降の変化 | 2000年以降の変化 |
|---|---|---|---|
| Kollum | +9.7% | +18.2% | +18.4% |
| フリースラント州 | — | — | — |
| オランダ | — | — | — |
情報源: JRC (European Commission's Joint Research Centre) の作業 GHS built-up grid
Kollumの年齢中央値
年齢中央値: 41.3歳
| 場所 | 平均年齢 | 年齢の中央値(女性) | 年齢の中央値(男性) |
|---|---|---|---|
| Kollum | 41.3 yrs | 42.1 yrs | 40.5 yrs |
| フリースラント州 | 41.9 yrs | 42.9 yrs | 41 yrs |
| オランダ | 41 yrs | 41.7 yrs | 40.2 yrs |
情報源: CIESIN (Center for International Earth Science Information Network)
Kollumの人口密度
人口密度: 373 / km²
| 場所 | 人口 | エリア | 密度 |
|---|---|---|---|
| Kollum | 5,600 | 15 km² | 373 / km² |
| フリースラント州 | 653,256 | 5,751.4 km² | 114 / km² |
| オランダ | 16.9 million | 41,398.3 km² | 409 / km² |
情報源: JRC (European Commission's Joint Research Centre) の作業 GHS built-up grid
Kollumの過去および予測人口
0年から2100年までの推定人口
情報源:
- JRC (European Commission's Joint Research Centre) の作業 GHS built-up grid
- CIESIN (Center for International Earth Science Information Network)
- [リンク] Klein Goldewijk, K., Beusen, A., Doelman, J., and Stehfest, E.: Anthropogenic land use estimates for the Holocene – HYDE 3.2, Earth Syst. Sci. Data, 9, 927–953, https://doi.org/10.5194/essd-9-927-2017, 2017.
市外局番
Kollumのビジネスによって使用されている市外局番の割合
価格分布
Kollumの価格によるビジネスの分布
人間開発指数(HDI)
平均余命、教育、および一人当たり収入の統計的複合指数。
出典: [リンク] Kummu, M., Taka, M. &Guillaume, J. 1990年から2015年までのGDPおよび人間開発指数のグローバルグリッドデータセット. Sci Data 5, 180004 (2018) doi:10.1038/sdata.2018.4
Kollumの国内総生産(GDP)
一人当たりGDP、購買力平価(2017年国際ドル固定)
| Data | 1990 | 1995 | 2000 | 2005 | 2010 | 2015 | 2020 | 2022 |
|---|---|---|---|---|---|---|---|---|
| 一人当たりGDP | $19,299 | $24,320 | $29,897 | $29,623 | $34,561 | $35,933 | $29,353 | $29,882 |
| GDP総額 | $1.6億 | $2.1億 | $2.6億 | $2.5億 | $2.9億 | $3.1億 | $2.5億 | $2.5億 |
出典: [リンク] Kummu, M., Kosonen, M. & Masoumzadeh Sayyar, S. Downscaled gridded global dataset for gross domestic product (GDP) per capita PPP over 1990–2022. Sci Data 12, 178 (2025) doi:10.1038/s41597-025-04487-x
KollumのCO2排出量
1人あたりの二酸化炭素(CO2)排出量(年間トン)
| 場所 | CO2排出量 | 一人当たりのCO2排出量 | CO2排出強度 |
|---|---|---|---|
| Kollum | 61,557 tn | 10.99 tn | 4,103.8 tons/km² |
| フリースラント州 | 4,518,084 tn | 6.92 tn | 785.6 tons/km² |
| オランダ | 167,743,568 tn | 9.91 tn | 4,051.9 tons/km² |
情報源: [リンク] Moran, D., Kanemoto K; Jiborn, M., Wood, R., Többen, J., and Seto, K.C. (2018) 13,000都市のカーボンフットプリント. Environmental Research Letters DOI: 10.1088/1748-9326/aac72a
KollumのCO2排出量
| 2013年のCO2排出量(トン/年) | 61,557 tn |
| 2013年の一人当たりCO2排出量(トン/年) | 10.99 tn |
| 2013年のCO2排出強度(トン/km²/年) | 4,103.8 tons/km² |
最近の近くの地震
マグニチュード3.0以上
| 日付▼ | 時間↕ | Magnitude↕ | Distance↕ | 深さ↕ | 場所↕ | リンク |
|---|---|---|---|---|---|---|
| 5/22/19 | 3:48 AM | 3.2 | 31.6 km | 10,000 m | 8km NNE of Winsum, Netherlands | usgs.gov |
| 2/7/13 | 11:19 PM | 3.4 | 34.6 km | 10,000 m | 11km NNE of Winsum, Netherlands | usgs.gov |
| 8/16/12 | 8:30 PM | 3.4 | 40.6 km | 3,000 m | The Netherlands | usgs.gov |
| 10/30/08 | 5:54 AM | 3.3 | 32 km | 3,000 m | The Netherlands | usgs.gov |
| 8/8/06 | 5:03 AM | 3.8 | 27.3 km | 10,000 m | The Netherlands | usgs.gov |
| 6/21/04 | 11:32 PM | 3 | 49.9 km | 5,000 m | The Netherlands | usgs.gov |
| 11/10/03 | 12:22 AM | 3.1 | 15.9 km | 10,000 m | The Netherlands | usgs.gov |
| 2/19/97 | 9:53 PM | 3 | 51 km | 5,000 m | The Netherlands | usgs.gov |

データについて
このページのデータは、公開されている各種ツールやリソースを用いて推定されています。保証なしで提供されており、不正確な情報が含まれる可能性があります。ご自身の責任でご利用ください。