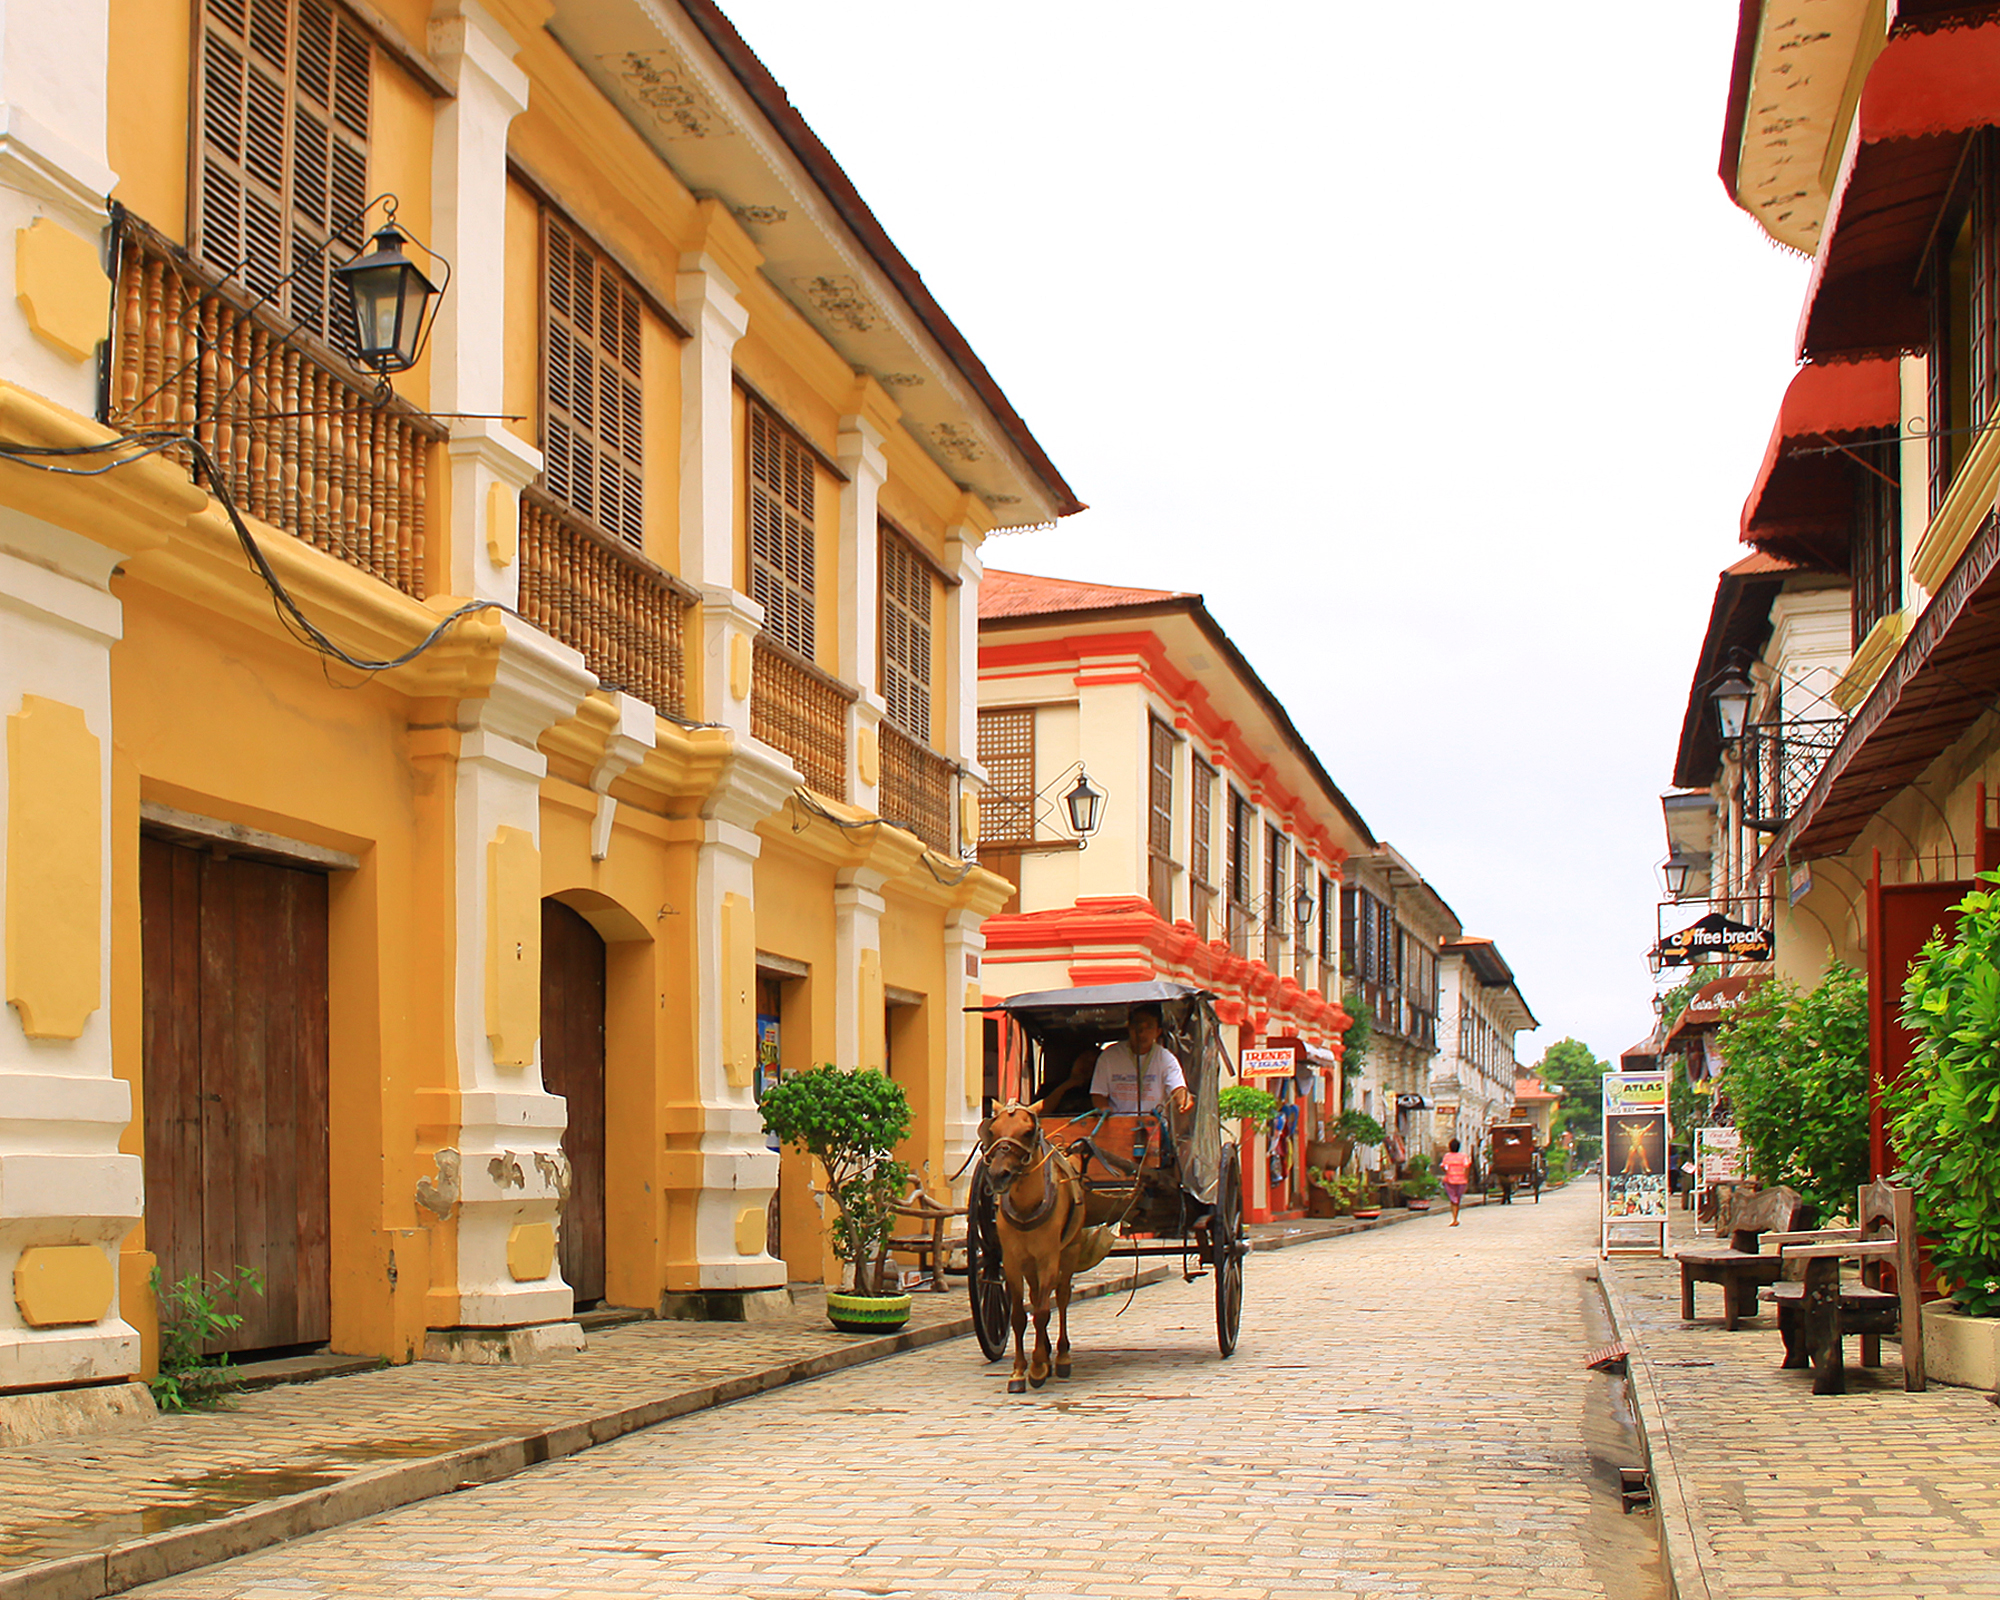
産業
Pidiganにおける業界別ビジネス分布
| 業界の説明 | 事業所数 |
|---|---|
| 教育 | 15 |
Pidiganのデータ
| エリア | 48.3 km² |
| 人口 | 12,959 |
| 男性人口 | 6,561 (50.6%) |
| 女性人口 | 6,398 (49.4%) |
| 人口変化 (1975 to 2020) | +264.3% |
| 人口変化 (2000 to 2020) | +28.4% |
| 平均年齢 | 24.8歳 (男性: 24.4, 女性: 25.3) |
| 一人当たりGDP(購買力平価) | $4,922 (2022) |
| 現地時間 | |
| 時間帯 | フィリピン標準時 |
| 緯度と経度 | 17.57000, 120.59030 |
| 郵便番号 | 2806 |
Pidiganの地図
インタラクティブマップ
Pidiganの人口
1975年から2030年
| Data | 1975 | 1990 | 2000 | 2015 | 2020 | 2025* | 2030* |
|---|---|---|---|---|---|---|---|
| 人口 | 3,557 | 7,822 | 10,095 | 11,922 | 12,959 | 13,247 | 13,474 |
| 人口密度 | 73.6 / km² | 161.9 / km² | 209 / km² | 246.8 / km² | 268.2 / km² | 274.2 / km² | 278.9 / km² |
* 予測値
情報源: JRC (European Commission's Joint Research Centre) の作業 GHS built-up gridPidiganの2000年から2020年までの人口変化
2000年から2020年にかけて28.4%増加
| 場所 | 1975年以降の変化 | 1990年以降の変化 | 2000年以降の変化 |
|---|---|---|---|
| Pidigan | +264.3% | +65.7% | +28.4% |
| フィリピン | — | — | — |
情報源: JRC (European Commission's Joint Research Centre) の作業 GHS built-up grid
Pidiganの年齢中央値
年齢中央値: 24.8歳
| 場所 | 平均年齢 | 年齢の中央値(女性) | 年齢の中央値(男性) |
|---|---|---|---|
| Pidigan | 24.8 yrs | 25.3 yrs | 24.4 yrs |
| フィリピン | 23.2 yrs | 23.6 yrs | 22.8 yrs |
情報源: CIESIN (Center for International Earth Science Information Network)
Pidiganの人口密度
人口密度: 268 / km²
| 場所 | 人口 | エリア | 密度 |
|---|---|---|---|
| Pidigan | 12,959 | 48.3 km² | 268 / km² |
| フィリピン | 96.6 million | 296,939.4 km² | 325 / km² |
情報源: JRC (European Commission's Joint Research Centre) の作業 GHS built-up grid
Pidiganの過去および予測人口
1850年から2100年までの推定人口
情報源:
- JRC (European Commission's Joint Research Centre) の作業 GHS built-up grid
- CIESIN (Center for International Earth Science Information Network)
- [リンク] Klein Goldewijk, K., Beusen, A., Doelman, J., and Stehfest, E.: Anthropogenic land use estimates for the Holocene – HYDE 3.2, Earth Syst. Sci. Data, 9, 927–953, https://doi.org/10.5194/essd-9-927-2017, 2017.
価格分布
Pidiganの価格によるビジネスの分布
人間開発指数(HDI)
平均余命、教育、および一人当たり収入の統計的複合指数。
出典: [リンク] Kummu, M., Taka, M. &Guillaume, J. 1990年から2015年までのGDPおよび人間開発指数のグローバルグリッドデータセット. Sci Data 5, 180004 (2018) doi:10.1038/sdata.2018.4
Pidiganの国内総生産(GDP)
一人当たりGDP、購買力平価(2017年国際ドル固定)
| Data | 1990 | 1995 | 2000 | 2005 | 2010 | 2015 | 2020 | 2022 |
|---|---|---|---|---|---|---|---|---|
| 一人当たりGDP | $1,388 | $1,609 | $1,843 | $2,321 | $2,521 | $3,859 | $4,104 | $4,922 |
| GDP総額 | $1270.9万 | $1617万 | $2054.3万 | $2774万 | $3117.9万 | $4925.6万 | $5374.7万 | $6505万 |
出典: [リンク] Kummu, M., Kosonen, M. & Masoumzadeh Sayyar, S. Downscaled gridded global dataset for gross domestic product (GDP) per capita PPP over 1990–2022. Sci Data 12, 178 (2025) doi:10.1038/s41597-025-04487-x
PidiganのCO2排出量
1人あたりの二酸化炭素(CO2)排出量(年間トン)
| 場所 | CO2排出量 | 一人当たりのCO2排出量 | CO2排出強度 |
|---|---|---|---|
| Pidigan | 14,541 tn | 1.12 tn | 301 tons/km² |
| フィリピン | 104,920,564 tn | 1.09 tn | 353.3 tons/km² |
情報源: [リンク] Moran, D., Kanemoto K; Jiborn, M., Wood, R., Többen, J., and Seto, K.C. (2018) 13,000都市のカーボンフットプリント. Environmental Research Letters DOI: 10.1088/1748-9326/aac72a
PidiganのCO2排出量
| 2013年のCO2排出量(トン/年) | 14,541 tn |
| 2013年の一人当たりCO2排出量(トン/年) | 1.12 tn |
| 2013年のCO2排出強度(トン/km²/年) | 301 tons/km² |
自然災害リスク
10のうちの相対リスク
| ハザード | リスクレベル |
|---|---|
| 干ばつ | 低 (2) |
| 地震 | 高 (8) |
| サイクロン | 高 (10) |
| 地すべり | 中 (7) |
*特に洪水または地滑りに関するリスクは、地域全体に及ぶとは限りません。
情報源:
- Dilley, M., R.S. Chen, U. Deichmann, A.L. Lerner-Lam, M. Arnold, J. Agwe, P. Buys, O. Kjekstad, B. Lyon, and G. Yetman. 2005. Natural Disaster Hotspots: A Global Risk Analysis. Washington, D.C.: World Bank. https://doi.org/10.1596/0-8213-5930-4.
- Center for Hazards and Risk Research - CHRR - Columbia University, Center for International Earth Science Information Network - CIESIN - Columbia University, and Norwegian Geotechnical Institute - NGI. 2005. Global Landslide Hazard Distribution. Palisades, NY: NASA Socioeconomic Data and Applications Center (SEDAC). https://doi.org/10.7927/H4P848VZ.
- Center for Hazards and Risk Research - CHRR - Columbia University, Center for International Earth Science Information Network - CIESIN - Columbia University, International Bank for Reconstruction and Development - The World Bank, and United Nations Environment Programme Global Resource Information Database Geneva - UNEP/GRID-Geneva. 2005. Global Cyclone Hazard Frequency and Distribution. Palisades, NY: NASA Socioeconomic Data and Applications Center (SEDAC). https://doi.org/10.7927/H4CZ353K.
- Center for Hazards and Risk Research - CHRR - Columbia University, Center for International Earth Science Information Network - CIESIN - Columbia University, and International Research Institute for Climate and Society - IRI - Columbia University. 2005. Global Drought Hazard Frequency and Distribution. Palisades, NY: NASA Socioeconomic Data and Applications Center (SEDAC). https://doi.org/10.7927/H4VX0DFT.
- Center for Hazards and Risk Research - CHRR - Columbia University, Center for International Earth Science Information Network - CIESIN - Columbia University. 2005. Global Earthquake Hazard Distribution - Peak Ground Acceleration. Palisades, NY: NASA Socioeconomic Data and Applications Center (SEDAC). https://doi.org/10.7927/H4BZ63ZS.
最近の近くの地震
マグニチュード3.0以上
| 日付▼ | 時間↕ | Magnitude↕ | Distance↕ | 深さ↕ | 場所↕ | リンク |
|---|---|---|---|---|---|---|
| 2/24/19 | 7:27 PM | 4.5 | 40.7 km | 37,320 m | 15km NNW of Puro Pingit, Philippines | usgs.gov |
| 2/4/19 | 12:55 PM | 4.7 | 48.7 km | 92,280 m | 2km SSE of Quirino, Philippines | usgs.gov |
| 11/25/18 | 9:21 AM | 4.7 | 37 km | 30,120 m | 4km SE of Nueva Era, Philippines | usgs.gov |
| 9/28/18 | 12:03 AM | 4.3 | 35.4 km | 10,000 m | 13km SE of Nueva Era, Philippines | usgs.gov |
| 5/30/18 | 10:46 AM | 4.6 | 48.3 km | 52,710 m | 4km NW of Espiritu, Philippines | usgs.gov |
| 2/13/18 | 3:27 PM | 4.4 | 36.5 km | 61,090 m | 12km WNW of Tamorong, Philippines | usgs.gov |
| 10/19/17 | 7:06 AM | 4.8 | 41.6 km | 10,000 m | 17km WSW of Fuerte, Philippines | usgs.gov |
| 6/25/17 | 9:18 AM | 4.1 | 31.8 km | 61,010 m | 12km SSW of Fuerte, Philippines | usgs.gov |
| 6/24/17 | 8:37 PM | 4.9 | 44.7 km | 41,350 m | 22km SW of Fuerte, Philippines | usgs.gov |
| 5/23/16 | 11:57 PM | 4.7 | 19.8 km | 75,280 m | 3km SSW of Pilar, Philippines | usgs.gov |
データについて
このページのデータは、公開されている各種ツールやリソースを用いて推定されています。保証なしで提供されており、不正確な情報が含まれる可能性があります。ご自身の責任でご利用ください。