産業
Detaにおける業界別ビジネス分布
| 業界の説明 | 事業所数 |
|---|---|
| 食料雑貨品店・スーパーマーケット | 12 |
| レストラン | 10 |
| ショッピング | 8 |
| 車の修理 | 6 |
| 薬局・ドラッグストア | 5 |
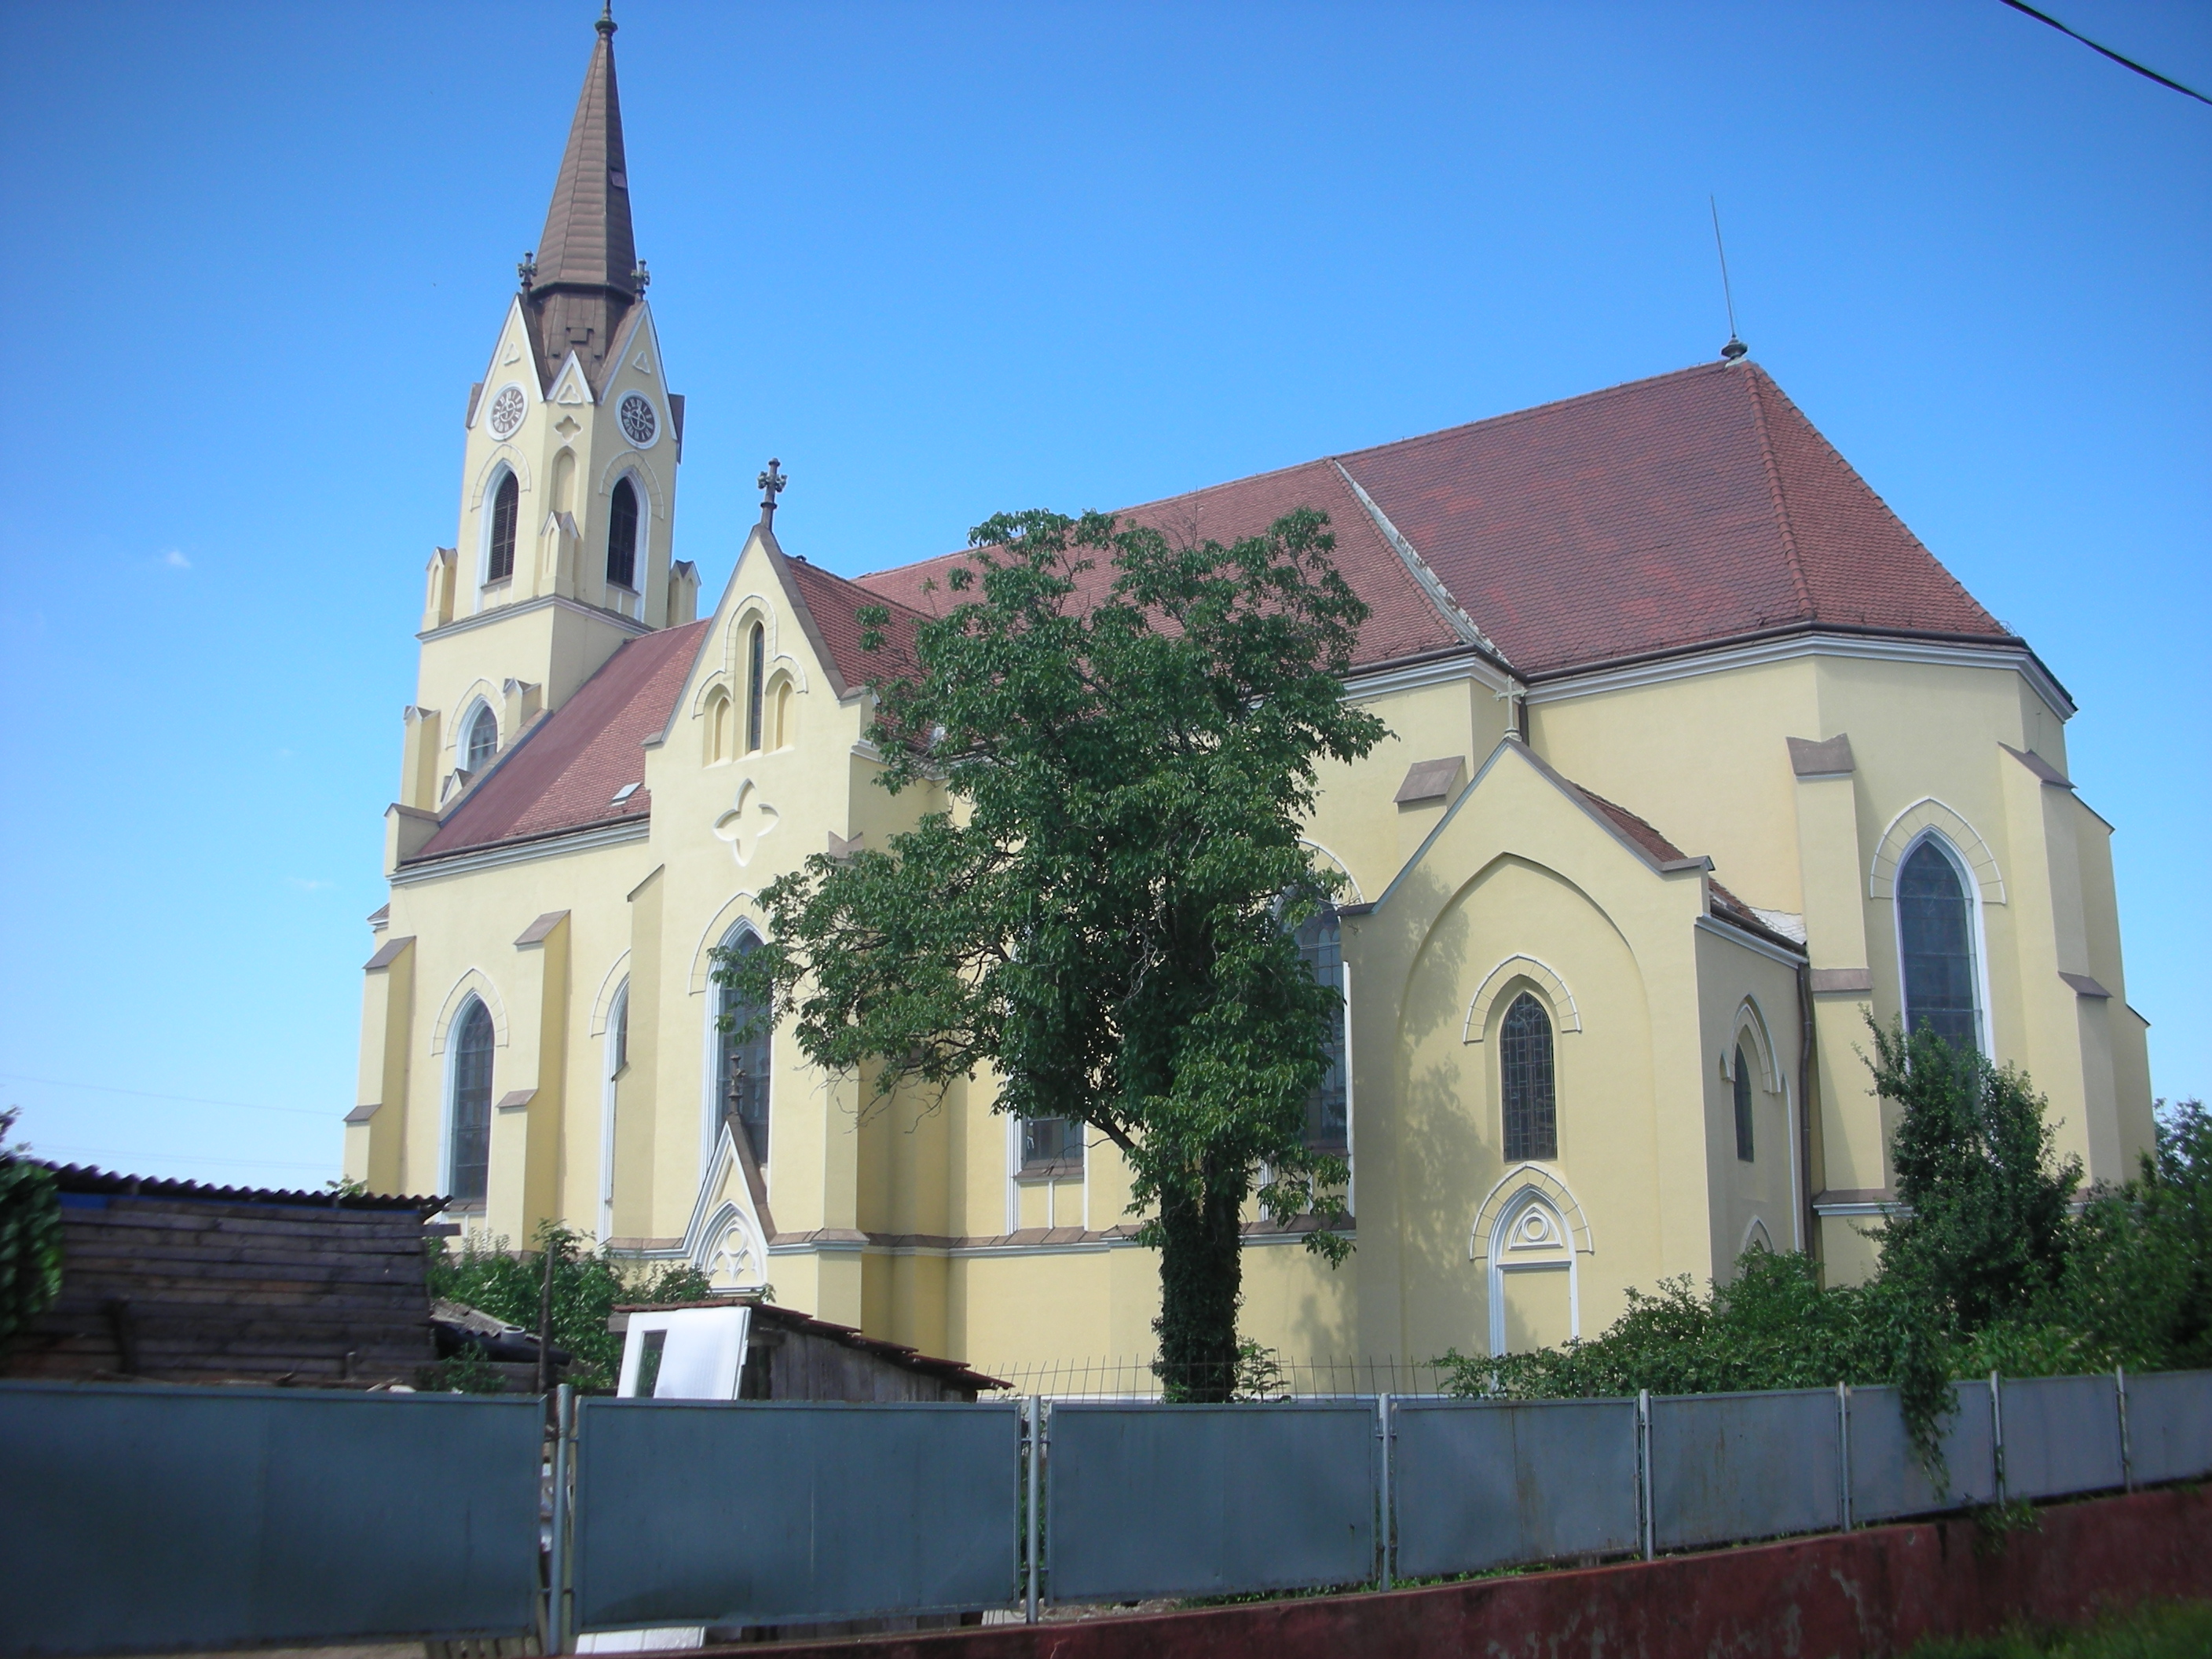
| 教会 | 5 |
| 全ての食品飲料 | 5 |
Detaのデータ
| エリア | 3.3 km² |
| 人口 | 3,540 |
| 男性人口 | 1,678 (47.4%) |
| 女性人口 | 1,862 (52.6%) |
| 人口変化 (1975 to 2020) | -16.4% |
| 人口変化 (2000 to 2020) | -34.6% |
| 平均年齢 | 40.1歳 (男性: 38.4, 女性: 41.4) |
| 一人当たりGDP(購買力平価) | $32,884 (2022) |
| 現地時間 | |
| 時間帯 | 東ヨーロッパ夏時間 |
| 緯度と経度 | 45.38889, 21.22444 |
| 郵便番号 | 305200 |
Detaの地図
インタラクティブマップ
Detaの人口
1975年から2030年
| Data | 1975 | 1990 | 2000 | 2015 | 2020 | 2025* | 2030* |
|---|---|---|---|---|---|---|---|
| 人口 | 4,236 | 5,405 | 5,415 | 4,839 | 3,540 | 3,498 | 3,334 |
| 人口密度 | 1,278.8 / km² | 1,631.7 / km² | 1,634.7 / km² | 1,460.8 / km² | 1,068.7 / km² | 1,056 / km² | 1,006.5 / km² |
* 予測値
情報源: JRC (European Commission's Joint Research Centre) の作業 GHS built-up gridDetaの2000年から2020年までの人口変化
2000年から2020年にかけて34.6%減少
| 場所 | 1975年以降の変化 | 1990年以降の変化 | 2000年以降の変化 |
|---|---|---|---|
| Deta | -16.4% | -34.5% | -34.6% |
| ティミシュ県 | — | — | — |
| ルーマニア | — | — | — |
情報源: JRC (European Commission's Joint Research Centre) の作業 GHS built-up grid
Detaの年齢中央値
年齢中央値: 40.1歳
| 場所 | 平均年齢 | 年齢の中央値(女性) | 年齢の中央値(男性) |
|---|---|---|---|
| Deta | 40.1 yrs | 41.4 yrs | 38.4 yrs |
| ティミシュ県 | 38.2 yrs | 39.7 yrs | 36.7 yrs |
| ルーマニア | 40.1 yrs | 41.6 yrs | 38.5 yrs |
情報源: CIESIN (Center for International Earth Science Information Network)
Detaの人口密度
人口密度: 1,069 / km²
| 場所 | 人口 | エリア | 密度 |
|---|---|---|---|
| Deta | 3,540 | 3.313 km² | 1,069 / km² |
| ティミシュ県 | 637,494 | 8,702.3 km² | 73.3 / km² |
| ルーマニア | 19.5 million | 238,387.8 km² | 81.8 / km² |
情報源: JRC (European Commission's Joint Research Centre) の作業 GHS built-up grid
Detaの過去および予測人口
0年から2100年までの推定人口
情報源:
- JRC (European Commission's Joint Research Centre) の作業 GHS built-up grid
- CIESIN (Center for International Earth Science Information Network)
- [リンク] Klein Goldewijk, K., Beusen, A., Doelman, J., and Stehfest, E.: Anthropogenic land use estimates for the Holocene – HYDE 3.2, Earth Syst. Sci. Data, 9, 927–953, https://doi.org/10.5194/essd-9-927-2017, 2017.
市外局番
Detaのビジネスによって使用されている市外局番の割合
価格分布
Detaの価格によるビジネスの分布
人間開発指数(HDI)
平均余命、教育、および一人当たり収入の統計的複合指数。
出典: [リンク] Kummu, M., Taka, M. &Guillaume, J. 1990年から2015年までのGDPおよび人間開発指数のグローバルグリッドデータセット. Sci Data 5, 180004 (2018) doi:10.1038/sdata.2018.4
Detaの国内総生産(GDP)
一人当たりGDP、購買力平価(2017年国際ドル固定)
| Data | 1990 | 1995 | 2000 | 2005 | 2010 | 2015 | 2020 | 2022 |
|---|---|---|---|---|---|---|---|---|
| 一人当たりGDP | $10,872 | $6,082 | $5,829 | $14,636 | $22,676 | $25,210 | $29,767 | $32,884 |
| GDP総額 | $3265.4万 | $1763.2万 | $1675.1万 | $4200.1万 | $6504.3万 | $7349.7万 | $8503.9万 | $9427.4万 |
出典: [リンク] Kummu, M., Kosonen, M. & Masoumzadeh Sayyar, S. Downscaled gridded global dataset for gross domestic product (GDP) per capita PPP over 1990–2022. Sci Data 12, 178 (2025) doi:10.1038/s41597-025-04487-x
DetaのCO2排出量
1人あたりの二酸化炭素(CO2)排出量(年間トン)
| 場所 | CO2排出量 | 一人当たりのCO2排出量 | CO2排出強度 |
|---|---|---|---|
| Deta | 20,534 tn | 5.8 tn | 6,198.8 tons/km² |
| ティミシュ県 | 3,698,353 tn | 5.8 tn | 425 tons/km² |
| ルーマニア | 86,961,323 tn | 4.46 tn | 364.8 tons/km² |
情報源: [リンク] Moran, D., Kanemoto K; Jiborn, M., Wood, R., Többen, J., and Seto, K.C. (2018) 13,000都市のカーボンフットプリント. Environmental Research Letters DOI: 10.1088/1748-9326/aac72a
DetaのCO2排出量
| 2013年のCO2排出量(トン/年) | 20,534 tn |
| 2013年の一人当たりCO2排出量(トン/年) | 5.8 tn |
| 2013年のCO2排出強度(トン/km²/年) | 6,198.8 tons/km² |
自然災害リスク
10のうちの相対リスク
| ハザード | リスクレベル |
|---|---|
| 干ばつ | 低 (2) |
| 洪水 | 高 (8) |
| 地震 | 中 (6) |
*特に洪水または地滑りに関するリスクは、地域全体に及ぶとは限りません。
情報源:
- Dilley, M., R.S. Chen, U. Deichmann, A.L. Lerner-Lam, M. Arnold, J. Agwe, P. Buys, O. Kjekstad, B. Lyon, and G. Yetman. 2005. Natural Disaster Hotspots: A Global Risk Analysis. Washington, D.C.: World Bank. https://doi.org/10.1596/0-8213-5930-4.
- Center for Hazards and Risk Research - CHRR - Columbia University, Center for International Earth Science Information Network - CIESIN - Columbia University, and International Research Institute for Climate and Society - IRI - Columbia University. 2005. Global Drought Hazard Frequency and Distribution. Palisades, NY: NASA Socioeconomic Data and Applications Center (SEDAC). https://doi.org/10.7927/H4VX0DFT.
- Center for Hazards and Risk Research - CHRR - Columbia University, Center for International Earth Science Information Network - CIESIN - Columbia University. 2005. Global Flood Hazard Frequency and Distribution. Palisades, NY: NASA Socioeconomic Data and Applications Center (SEDAC). https://doi.org/10.7927/H4668B3D.
- Center for Hazards and Risk Research - CHRR - Columbia University, Center for International Earth Science Information Network - CIESIN - Columbia University. 2005. Global Earthquake Hazard Distribution - Peak Ground Acceleration. Palisades, NY: NASA Socioeconomic Data and Applications Center (SEDAC). https://doi.org/10.7927/H4BZ63ZS.
最近の近くの地震
マグニチュード3.0以上
| 日付▼ | 時間↕ | Magnitude↕ | Distance↕ | 深さ↕ | 場所↕ | リンク |
|---|---|---|---|---|---|---|
| 12/23/18 | 6:33 AM | 4.1 | 26.3 km | 10,000 m | 2km NW of Hajducica, Serbia | usgs.gov |
| 10/31/14 | 11:00 PM | 4.1 | 87.3 km | 4,100 m | 1km NNE of Teregova, Romania | usgs.gov |
| 6/22/08 | 1:35 PM | 3.4 | 91.9 km | 5,000 m | Serbia | usgs.gov |
| 2/7/08 | 4:45 PM | 3.6 | 69.6 km | 19,000 m | Serbia-Romania border region | usgs.gov |
| 9/20/07 | 10:46 PM | 3.3 | 57.4 km | 14,900 m | Serbia | usgs.gov |
| 7/30/07 | 8:51 PM | 3.1 | 53.5 km | 10,000 m | Serbia | usgs.gov |
| 4/20/05 | 8:17 AM | 3.3 | 86.8 km | 18,700 m | Romania | usgs.gov |
| 2/14/05 | 11:37 PM | 4.2 | 94.8 km | 20,900 m | Romania | usgs.gov |
| 8/2/02 | 9:37 AM | 4.5 | 81.5 km | 10,000 m | Serbia-Romania border region | usgs.gov |
| 5/24/02 | 8:42 PM | 4.7 | 76.1 km | 10,000 m | Serbia-Romania border region | usgs.gov |

データについて
このページのデータは、公開されている各種ツールやリソースを用いて推定されています。保証なしで提供されており、不正確な情報が含まれる可能性があります。ご自身の責任でご利用ください。