Mendocinoのカテゴリー
ブティック女性用衣料宝石や時計服屋ラジオ放送局NPO法人コミュニティ センター教会消防署配送、郵送サービスアーキテクツ住宅の建設塗装・塗装請負会社建物の建設日用品店教育教育センターアートギャラリーウェブ デザイナーエンターテインメント提供業者ブライダル カメラマン写真家州立公園景勝地美術館観光名所カフェベーカリーレストランワイン バーATM弁護士心理療法士歯医者鍼デイスパマッサージ美容院美容院企業経営コンサルタント不動産コンサルタント不動産仲介業不動産業者ギフト ショップショッピング宝石商生花店公共公園バケーション ホーム レンタル代理店ホテル・モーテル
1-50/56表示
産業
Mendocinoにおける業界別ビジネス分布
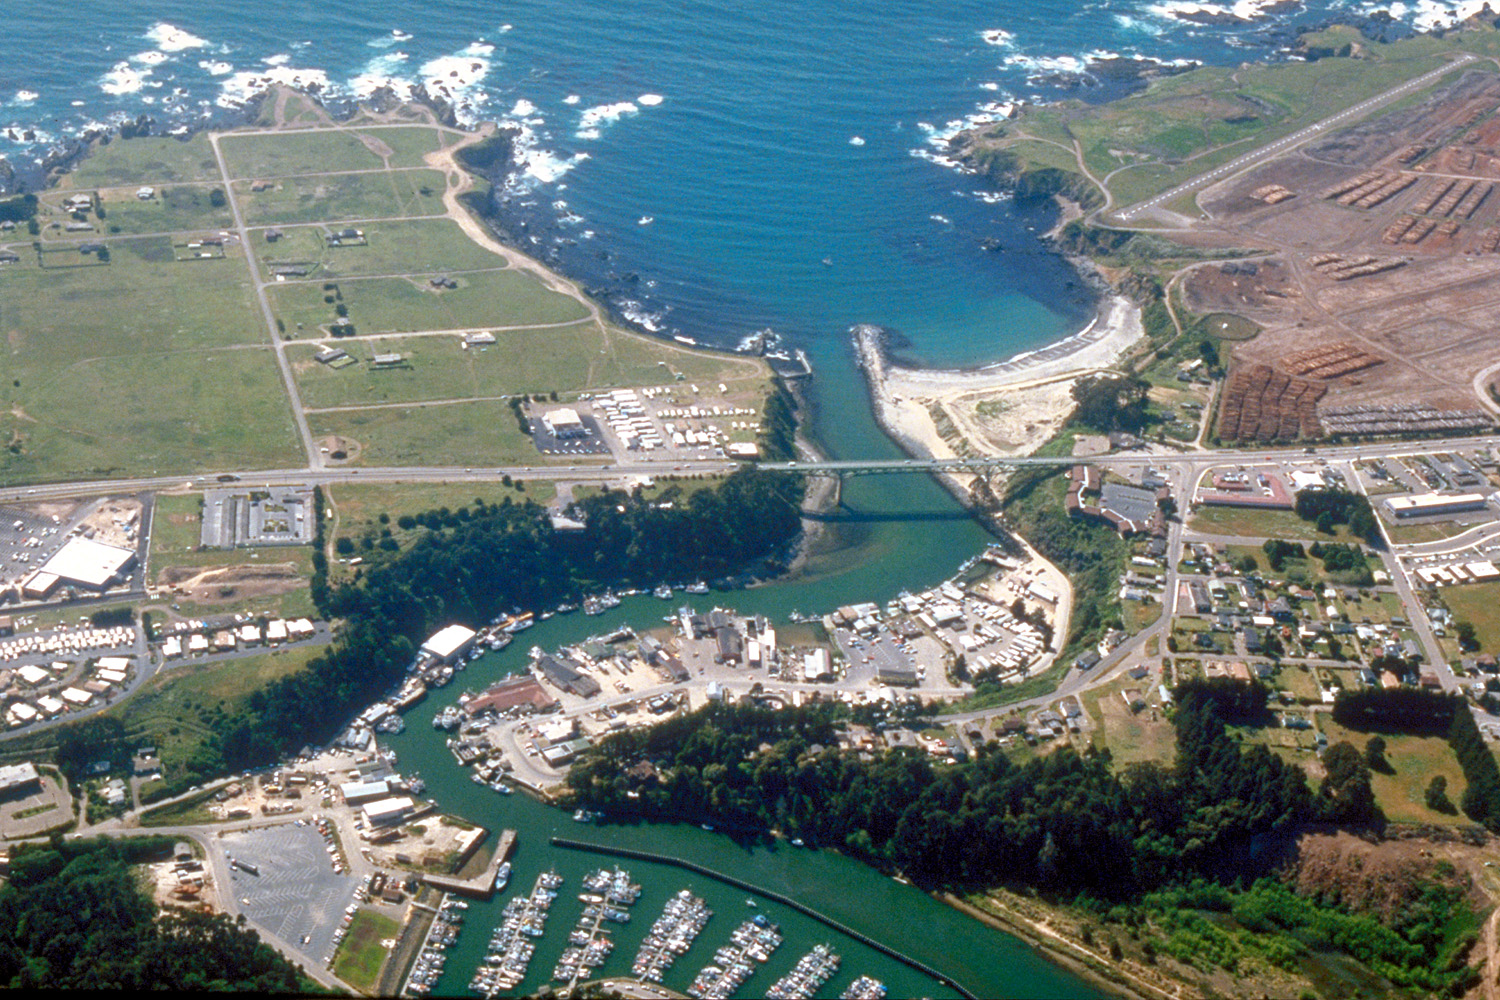
Mendocinoの地図
インタラクティブマップ
Mendocinoの人口
1975年から2020年
| Data | 1975 | 1990 | 2000 | 2015 | 2020 |
|---|---|---|---|---|---|
| 人口 | 617 | 736 | 883 | 894 | 915 |
| 人口密度 | 248.2 / mi² | 296.1 / mi² | 355.3 / mi² | 359.7 / mi² | 368.1 / mi² |
情報源: JRC (European Commission's Joint Research Centre) の作業 GHS built-up grid
Mendocinoの2000年から2015年までの人口変化
2000年から2015年にかけて1.2%増加
| 場所 | 1975年以降の変化 | 1990年以降の変化 | 2000年以降の変化 |
|---|---|---|---|
| Mendocino | +44.9% | +21.5% | +1.2% |
| カリフォルニア州 | +51.8% | +28.5% | +13.9% |
| アメリカ合衆国 | +46.9% | +27.2% | +13.7% |
情報源: JRC (European Commission's Joint Research Centre) の作業 GHS built-up grid
Mendocinoの年齢中央値
年齢中央値: 55.7歳
| 場所 | 平均年齢 | 年齢の中央値(女性) | 年齢の中央値(男性) |
|---|---|---|---|
| Mendocino | 55.7 yrs | 57.7 yrs | 52.2 yrs |
| カリフォルニア州 | 35.3 yrs | 36.5 yrs | 34.2 yrs |
| アメリカ合衆国 | 37.4 yrs | 38.7 yrs | 36.1 yrs |
情報源: CIESIN (Center for International Earth Science Information Network)
Mendocinoの人口密度
人口密度: 368 / mi²
| 場所 | 人口 | エリア | 密度 |
|---|---|---|---|
| Mendocino | 915 | 2.486 sq mi | 368 / mi² |
| カリフォルニア州 | 38.8 million | 163,694.5 sq mi | 237 / mi² |
| アメリカ合衆国 | 321.6 million | 3,796,740.8 sq mi | 84.7 / mi² |
情報源: JRC (European Commission's Joint Research Centre) の作業 GHS built-up grid
Mendocinoの過去および予測人口
1860年から2100年までの推定人口
情報源:
- JRC (European Commission's Joint Research Centre) の作業 GHS built-up grid
- CIESIN (Center for International Earth Science Information Network)
- [リンク] Klein Goldewijk, K., Beusen, A., Doelman, J., and Stehfest, E.: Anthropogenic land use estimates for the Holocene – HYDE 3.2, Earth Syst. Sci. Data, 9, 927–953, https://doi.org/10.5194/essd-9-927-2017, 2017.
Mendocinoの地区
Mendocinoの地区別の企業の割合
価格分布
Mendocinoの価格によるビジネスの分布
人間開発指数(HDI)
平均余命、教育、および一人当たり収入の統計的複合指数。
出典: [リンク] Kummu, M., Taka, M. &Guillaume, J. 1990年から2015年までのGDPおよび人間開発指数のグローバルグリッドデータセット. Sci Data 5, 180004 (2018) doi:10.1038/sdata.2018.4
MendocinoのCO2排出量
1人あたりの二酸化炭素(CO2)排出量(年間トン)
| 場所 | CO2排出量 | 一人当たりのCO2排出量 | CO2排出強度 |
|---|---|---|---|
| Mendocino | 6,871 tn | 7.51 tn | 2,764.3 tons/mi² |
| カリフォルニア州 | 625,399,868 tn | 16.13 tn | 3,820.5 tons/mi² |
| アメリカ合衆国 | 5,664,619,810 tn | 17.62 tn | 1,492 tons/mi² |
情報源: [リンク] Moran, D., Kanemoto K; Jiborn, M., Wood, R., Többen, J., and Seto, K.C. (2018) 13,000都市のカーボンフットプリント. Environmental Research Letters DOI: 10.1088/1748-9326/aac72a
MendocinoのCO2排出量
| 2013年のCO2排出量(トン/年) | 6,871 tn |
| 2013年の一人当たりCO2排出量(トン/年) | 7.51 tn |
| 2013年のCO2排出強度(トン/mi²/年) | 2,764.3 tons/mi² |
自然災害リスク
Relative risk out of 10
| ハザード | Risk Level |
|---|---|
| Drought | High (9) |
| Flood | Medium (7) |
| Earthquake | Medium (6) |
| Landslide | Medium (6) |
* Risk, particularly concerning flood or landslide, may not be for the entire area.
情報源:
- Dilley, M., R.S. Chen, U. Deichmann, A.L. Lerner-Lam, M. Arnold, J. Agwe, P. Buys, O. Kjekstad, B. Lyon, and G. Yetman. 2005. Natural Disaster Hotspots: A Global Risk Analysis. Washington, D.C.: World Bank. https://doi.org/10.1596/0-8213-5930-4.
- Center for Hazards and Risk Research - CHRR - Columbia University, Center for International Earth Science Information Network - CIESIN - Columbia University, and Norwegian Geotechnical Institute - NGI. 2005. Global Landslide Hazard Distribution. Palisades, NY: NASA Socioeconomic Data and Applications Center (SEDAC). https://doi.org/10.7927/H4P848VZ.
- Center for Hazards and Risk Research - CHRR - Columbia University, Center for International Earth Science Information Network - CIESIN - Columbia University, and International Research Institute for Climate and Society - IRI - Columbia University. 2005. Global Drought Hazard Frequency and Distribution. Palisades, NY: NASA Socioeconomic Data and Applications Center (SEDAC). https://doi.org/10.7927/H4VX0DFT.
- Center for Hazards and Risk Research - CHRR - Columbia University, Center for International Earth Science Information Network - CIESIN - Columbia University. 2005. Global Flood Hazard Frequency and Distribution. Palisades, NY: NASA Socioeconomic Data and Applications Center (SEDAC). https://doi.org/10.7927/H4668B3D.
- Center for Hazards and Risk Research - CHRR - Columbia University, Center for International Earth Science Information Network - CIESIN - Columbia University. 2005. Global Earthquake Hazard Distribution - Peak Ground Acceleration. Palisades, NY: NASA Socioeconomic Data and Applications Center (SEDAC). https://doi.org/10.7927/H4BZ63ZS.
最近の近くの地震
マグニチュード3.0以上
| 日付▼ | 時間↕ | Magnitude↕ | Distance↕ | 深さ↕ | 場所↕ | リンク |
|---|---|---|---|---|---|---|
| 11/9/18 | 8:31 PM | 3.79 | 46 km | 5,550 m | 6km ENE of Willits, CA | usgs.gov |
| 12/14/17 | 4:57 AM | 4.26 | 35.8 km | 7,040 m | 17km WSW of Laytonville, CA | usgs.gov |
| 11/6/16 | 1:00 PM | 4.06 | 41.5 km | -650 m | 13km WSW of Laytonville, California | usgs.gov |
| 11/3/16 | 12:57 PM | 3.82 | 41.9 km | -570 m | 13km WSW of Laytonville, California | usgs.gov |
| 12/3/15 | 11:02 AM | 3.04 | 27.9 km | 6,050 m | 17km ENE of Fort Bragg, California | usgs.gov |
| 8/29/15 | 8:13 AM | 3.04 | 26.3 km | 5,386 m | 17km WNW of Brooktrails, California | usgs.gov |
| 8/29/15 | 8:13 AM | 3.56 | 26 km | 5,046 m | 18km ENE of Fort Bragg, California | usgs.gov |
| 7/27/15 | 6:24 PM | 3.45 | 46.8 km | 5,880 m | 6km E of Point Arena, California | usgs.gov |
| 10/4/14 | 3:45 PM | 3.93 | 27 km | 3,403 m | 15km SW of Willits, California | usgs.gov |
| 2/15/13 | 9:18 PM | 3.36 | 46.3 km | 5,364 m | 5km WSW of Laytonville, California | usgs.gov |


データについて
このページのデータは、公開されている各種ツールやリソースを用いて推定されています。保証なしで提供されており、不正確な情報が含まれる可能性があります。ご自身の責任でご利用ください。