Prentissのカテゴリー
ガソリンスタンドタイヤショップ塗装・板金自動車修理・整備作物栽培家農業バプテスト教会宗教役所政府機関教会無宗派教会社会事業団住宅の建設住宅建設内装工事請負業者塗装・塗装請負会社空調設備工事業者教育エンターテインメント提供業者ファーストフードレストランレストラン食料雑貨品店・スーパーマーケットATMローン会社会計士保険会社弁護士法律事務税務対策サービス送金サービスナース・プラクティショナー内科医と外科医内科診療所墓地家庭医歯医者精神衛生サービス診療所美容院企業経営コンサルタント企業間取引業産業向けサービス不動産仲介業100 円ショップコンビニエンスストアディスカウント ストアドラッグ ストア薬局ホテル・モーテル
1-50/51表示
産業
Prentissにおける業界別ビジネス分布
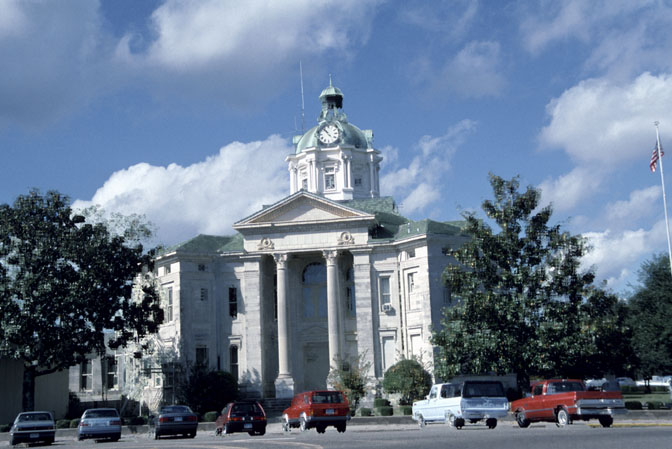
Prentissの地図
インタラクティブマップ
Prentissの人口
1975年から2020年
| Data | 1975 | 1990 | 2000 | 2015 | 2020 |
|---|---|---|---|---|---|
| 人口 | 865 | 1,022 | 1,220 | 1,017 | 1,028 |
| 人口密度 | 465.5 / mi² | 550 / mi² | 656.6 / mi² | 547.3 / mi² | 553.2 / mi² |
情報源: JRC (European Commission's Joint Research Centre) の作業 GHS built-up grid
Prentissの2000年から2015年までの人口変化
2000年から2015年にかけて16.6%減少
| 場所 | 1975年以降の変化 | 1990年以降の変化 | 2000年以降の変化 |
|---|---|---|---|
| Prentiss | +17.6% | -0.5% | -16.6% |
| ミシシッピ州 | +18% | +11.9% | +5.6% |
| アメリカ合衆国 | +46.9% | +27.2% | +13.7% |
情報源: JRC (European Commission's Joint Research Centre) の作業 GHS built-up grid
Prentissの年齢中央値
年齢中央値: 45.5歳
| 場所 | 平均年齢 | 年齢の中央値(女性) | 年齢の中央値(男性) |
|---|---|---|---|
| Prentiss | 45.5 yrs | 49.6 yrs | 41.3 yrs |
| ミシシッピ州 | 36.1 yrs | 37.5 yrs | 34.6 yrs |
| アメリカ合衆国 | 37.4 yrs | 38.7 yrs | 36.1 yrs |
情報源: CIESIN (Center for International Earth Science Information Network)
Prentissの人口密度
人口密度: 553 / mi²
| 場所 | 人口 | エリア | 密度 |
|---|---|---|---|
| Prentiss | 1,028 | 1.858 sq mi | 553 / mi² |
| ミシシッピ州 | 3 million | 48,431.7 sq mi | 62.3 / mi² |
| アメリカ合衆国 | 321.6 million | 3,796,740.8 sq mi | 84.7 / mi² |
情報源: JRC (European Commission's Joint Research Centre) の作業 GHS built-up grid
Prentissの過去および予測人口
1820年から2100年までの推定人口
情報源:
- JRC (European Commission's Joint Research Centre) の作業 GHS built-up grid
- CIESIN (Center for International Earth Science Information Network)
- [リンク] Klein Goldewijk, K., Beusen, A., Doelman, J., and Stehfest, E.: Anthropogenic land use estimates for the Holocene – HYDE 3.2, Earth Syst. Sci. Data, 9, 927–953, https://doi.org/10.5194/essd-9-927-2017, 2017.
価格分布
Prentissの価格によるビジネスの分布
人間開発指数(HDI)
平均余命、教育、および一人当たり収入の統計的複合指数。
出典: [リンク] Kummu, M., Taka, M. &Guillaume, J. 1990年から2015年までのGDPおよび人間開発指数のグローバルグリッドデータセット. Sci Data 5, 180004 (2018) doi:10.1038/sdata.2018.4
PrentissのCO2排出量
1人あたりの二酸化炭素(CO2)排出量(年間トン)
| 場所 | CO2排出量 | 一人当たりのCO2排出量 | CO2排出強度 |
|---|---|---|---|
| Prentiss | 16,366 tn | 15.92 tn | 8,807.7 tons/mi² |
| ミシシッピ州 | 48,902,271 tn | 16.21 tn | 1,009.7 tons/mi² |
| アメリカ合衆国 | 5,664,619,810 tn | 17.62 tn | 1,492 tons/mi² |
情報源: [リンク] Moran, D., Kanemoto K; Jiborn, M., Wood, R., Többen, J., and Seto, K.C. (2018) 13,000都市のカーボンフットプリント. Environmental Research Letters DOI: 10.1088/1748-9326/aac72a
PrentissのCO2排出量
| 2013年のCO2排出量(トン/年) | 16,366 tn |
| 2013年の一人当たりCO2排出量(トン/年) | 15.92 tn |
| 2013年のCO2排出強度(トン/mi²/年) | 8,807.7 tons/mi² |
自然災害リスク
Relative risk out of 10
| ハザード | Risk Level |
|---|---|
| Flood | High (8) |
| Cyclone | Medium (7) |
* Risk, particularly concerning flood or landslide, may not be for the entire area.
情報源:
- Dilley, M., R.S. Chen, U. Deichmann, A.L. Lerner-Lam, M. Arnold, J. Agwe, P. Buys, O. Kjekstad, B. Lyon, and G. Yetman. 2005. Natural Disaster Hotspots: A Global Risk Analysis. Washington, D.C.: World Bank. https://doi.org/10.1596/0-8213-5930-4.
- Center for Hazards and Risk Research - CHRR - Columbia University, Center for International Earth Science Information Network - CIESIN - Columbia University, International Bank for Reconstruction and Development - The World Bank, and United Nations Environment Programme Global Resource Information Database Geneva - UNEP/GRID-Geneva. 2005. Global Cyclone Hazard Frequency and Distribution. Palisades, NY: NASA Socioeconomic Data and Applications Center (SEDAC). https://doi.org/10.7927/H4CZ353K.
- Center for Hazards and Risk Research - CHRR - Columbia University, Center for International Earth Science Information Network - CIESIN - Columbia University. 2005. Global Flood Hazard Frequency and Distribution. Palisades, NY: NASA Socioeconomic Data and Applications Center (SEDAC). https://doi.org/10.7927/H4668B3D.


データについて
このページのデータは、公開されている各種ツールやリソースを用いて推定されています。保証なしで提供されており、不正確な情報が含まれる可能性があります。ご自身の責任でご利用ください。