Bejumaのカテゴリー
オートバイの修理オートバイ部品専門店ガソリンスタンド自動車修理・整備自動車用品ショップ車の修理工芸品店農業農業生産養鶏場服屋インターネット サービス プロバイダ携帯電話ショップ電気通信事業者NPO法人政府機関教会電器店ホームセンター住宅開発工具店日用品店電力会社教育教育センター観光名所アイスクリーム店カフェケーキ屋コーヒーショップバーガーレストランバー・パブ・居酒屋ファーストフードレストランベーカリーレストラン精肉店食料雑貨品店・スーパーマーケット苗床・庭園商品銀行病院マニキュアとペディキュア理髪店美容院美容院事務用品・文房具店広告代理店アパートカントリーハウス団地団地/共同住宅
1-50/67表示
産業
Bejumaにおける業界別ビジネス分布
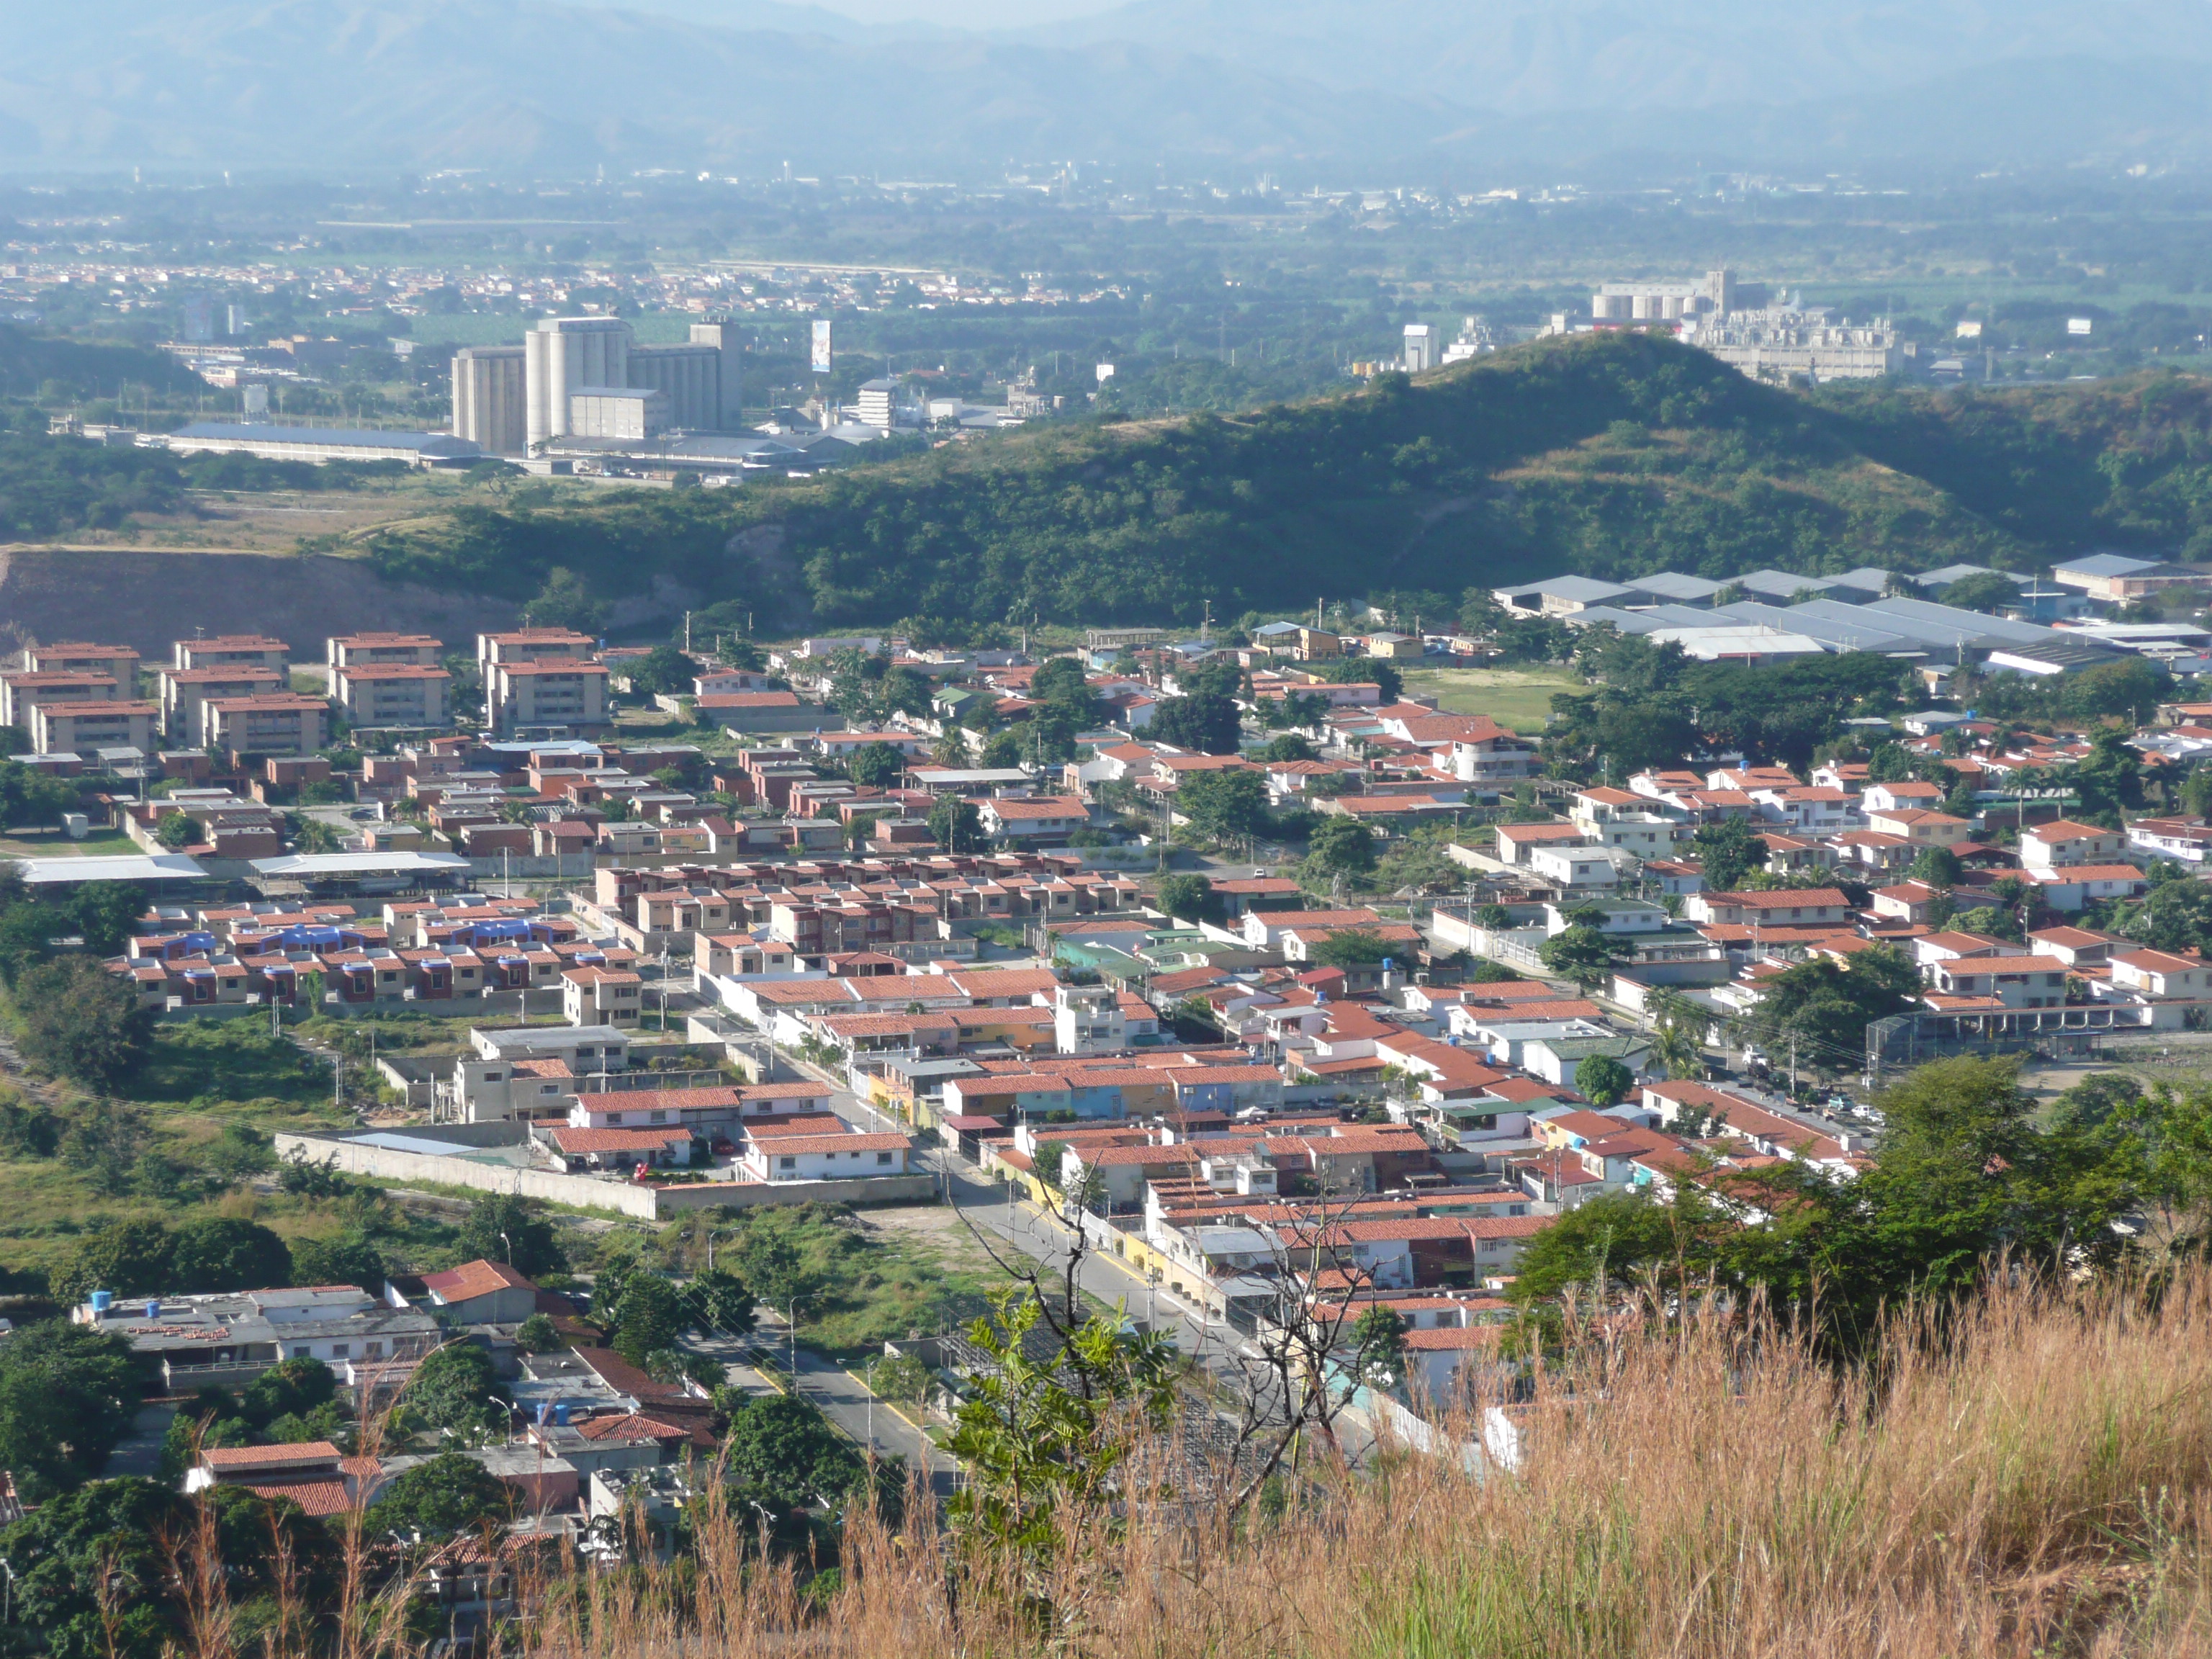
Bejumaの地図
インタラクティブマップ
Bejumaの人口
1975年から2030年
| Data | 1975 | 1990 | 2000 | 2015 | 2020 | 2025* | 2030* |
|---|---|---|---|---|---|---|---|
| 人口 | 23,387 | 39,013 | 50,640 | 68,315 | 67,638 | 71,364 | 76,594 |
| 人口密度 | 42.3 / km² | 70.6 / km² | 91.7 / km² | 123.7 / km² | 122.4 / km² | 129.2 / km² | 138.6 / km² |
* 予測値
情報源: JRC (European Commission's Joint Research Centre) の作業 GHS built-up gridBejumaの2000年から2020年までの人口変化
2000年から2020年にかけて33.6%増加
| 場所 | 1975年以降の変化 | 1990年以降の変化 | 2000年以降の変化 |
|---|---|---|---|
| Bejuma | +189.2% | +73.4% | +33.6% |
| カラボボ州 | — | — | — |
| ベネズエラ | — | — | — |
情報源: JRC (European Commission's Joint Research Centre) の作業 GHS built-up grid
Bejumaの年齢中央値
年齢中央値: 27.3歳
| 場所 | 平均年齢 | 年齢の中央値(女性) | 年齢の中央値(男性) |
|---|---|---|---|
| Bejuma | 27.3 yrs | 27.7 yrs | 27 yrs |
| カラボボ州 | 28 yrs | 28.6 yrs | 27.3 yrs |
| ベネズエラ | 27.3 yrs | 27.9 yrs | 26.6 yrs |
情報源: CIESIN (Center for International Earth Science Information Network)
Bejumaの人口密度
人口密度: 122 / km²
| 場所 | 人口 | エリア | 密度 |
|---|---|---|---|
| Bejuma | 67,638 | 552.4 km² | 122 / km² |
| カラボボ州 | 2.6 million | 5,137.2 km² | 498 / km² |
| ベネズエラ | 30.8 million | 912,498.1 km² | 33.7 / km² |
情報源: JRC (European Commission's Joint Research Centre) の作業 GHS built-up grid
Bejumaの過去および予測人口
0年から2100年までの推定人口
情報源:
- JRC (European Commission's Joint Research Centre) の作業 GHS built-up grid
- CIESIN (Center for International Earth Science Information Network)
- [リンク] Klein Goldewijk, K., Beusen, A., Doelman, J., and Stehfest, E.: Anthropogenic land use estimates for the Holocene – HYDE 3.2, Earth Syst. Sci. Data, 9, 927–953, https://doi.org/10.5194/essd-9-927-2017, 2017.
市外局番
Bejumaのビジネスによって使用されている市外局番の割合
価格分布
Bejumaの価格によるビジネスの分布
人間開発指数(HDI)
平均余命、教育、および一人当たり収入の統計的複合指数。
出典: [リンク] Kummu, M., Taka, M. &Guillaume, J. 1990年から2015年までのGDPおよび人間開発指数のグローバルグリッドデータセット. Sci Data 5, 180004 (2018) doi:10.1038/sdata.2018.4
Bejumaの国内総生産(GDP)
一人当たりGDP、購買力平価(2017年国際ドル固定)
| Data | 1990 | 1995 | 2000 | 2005 | 2010 | 2015 | 2020 | 2022 |
|---|---|---|---|---|---|---|---|---|
| 一人当たりGDP | $29,114 | $35,363 | $29,087 | $29,465 | $38,977 | $34,043 | $10,121 | $8,899 |
| GDP総額 | $13.3億 | $18.8億 | $17.5億 | $20億 | $29.3億 | $26.1億 | $7.3億 | $6.6億 |
出典: [リンク] Kummu, M., Kosonen, M. & Masoumzadeh Sayyar, S. Downscaled gridded global dataset for gross domestic product (GDP) per capita PPP over 1990–2022. Sci Data 12, 178 (2025) doi:10.1038/s41597-025-04487-x
BejumaのCO2排出量
1人あたりの二酸化炭素(CO2)排出量(年間トン)
| 場所 | CO2排出量 | 一人当たりのCO2排出量 | CO2排出強度 |
|---|---|---|---|
| Bejuma | 399,911 tn | 5.91 tn | 723.9 tons/km² |
| カラボボ州 | 14,985,715 tn | 5.85 tn | 2,917.1 tons/km² |
| ベネズエラ | 161,060,019 tn | 5.23 tn | 176.5 tons/km² |
情報源: [リンク] Moran, D., Kanemoto K; Jiborn, M., Wood, R., Többen, J., and Seto, K.C. (2018) 13,000都市のカーボンフットプリント. Environmental Research Letters DOI: 10.1088/1748-9326/aac72a
BejumaのCO2排出量
| 2013年のCO2排出量(トン/年) | 399,911 tn |
| 2013年の一人当たりCO2排出量(トン/年) | 5.91 tn |
| 2013年のCO2排出強度(トン/km²/年) | 723.9 tons/km² |
自然災害リスク
10のうちの相対リスク
| ハザード | リスクレベル |
|---|---|
| 干ばつ | 中 (4) |
| 洪水 | 高 (8) |
| 地震 | 中 (6.9) |
| 地すべり | 中 (6) |
*特に洪水または地滑りに関するリスクは、地域全体に及ぶとは限りません。
情報源:
- Dilley, M., R.S. Chen, U. Deichmann, A.L. Lerner-Lam, M. Arnold, J. Agwe, P. Buys, O. Kjekstad, B. Lyon, and G. Yetman. 2005. Natural Disaster Hotspots: A Global Risk Analysis. Washington, D.C.: World Bank. https://doi.org/10.1596/0-8213-5930-4.
- Center for Hazards and Risk Research - CHRR - Columbia University, Center for International Earth Science Information Network - CIESIN - Columbia University, and Norwegian Geotechnical Institute - NGI. 2005. Global Landslide Hazard Distribution. Palisades, NY: NASA Socioeconomic Data and Applications Center (SEDAC). https://doi.org/10.7927/H4P848VZ.
- Center for Hazards and Risk Research - CHRR - Columbia University, Center for International Earth Science Information Network - CIESIN - Columbia University, and International Research Institute for Climate and Society - IRI - Columbia University. 2005. Global Drought Hazard Frequency and Distribution. Palisades, NY: NASA Socioeconomic Data and Applications Center (SEDAC). https://doi.org/10.7927/H4VX0DFT.
- Center for Hazards and Risk Research - CHRR - Columbia University, Center for International Earth Science Information Network - CIESIN - Columbia University. 2005. Global Flood Hazard Frequency and Distribution. Palisades, NY: NASA Socioeconomic Data and Applications Center (SEDAC). https://doi.org/10.7927/H4668B3D.
- Center for Hazards and Risk Research - CHRR - Columbia University, Center for International Earth Science Information Network - CIESIN - Columbia University. 2005. Global Earthquake Hazard Distribution - Peak Ground Acceleration. Palisades, NY: NASA Socioeconomic Data and Applications Center (SEDAC). https://doi.org/10.7927/H4BZ63ZS.
最近の近くの地震
マグニチュード3.0以上
| 日付▼ | 時間↕ | Magnitude↕ | Distance↕ | 深さ↕ | 場所↕ | リンク |
|---|---|---|---|---|---|---|
| 4/16/19 | 8:40 AM | 3.5 | 35.8 km | 10,000 m | 2km SE of San Diego, Venezuela | usgs.gov |
| 1/29/19 | 7:33 AM | 4.1 | 36 km | 18,550 m | 1km NE of San Diego, Venezuela | usgs.gov |
| 12/27/18 | 9:24 AM | 4.9 | 35.1 km | 10,000 m | 0km SSE of San Diego, Venezuela | usgs.gov |
| 12/27/18 | 9:13 AM | 4.2 | 47.8 km | 10,000 m | 9km NW of San Joaquin, Venezuela | usgs.gov |
| 12/27/18 | 8:59 AM | 5.4 | 40.2 km | 8,000 m | 5km NW of Guacara, Venezuela | usgs.gov |
| 12/5/18 | 9:33 AM | 4.7 | 55.7 km | 10,000 m | 9km WNW of Farriar, Venezuela | usgs.gov |
| 10/28/18 | 10:58 PM | 4.4 | 90.8 km | 20,330 m | 9km ESE of Duaca, Venezuela | usgs.gov |
| 5/23/18 | 11:23 AM | 4.2 | 36.9 km | 10,000 m | 7km N of San Diego, Venezuela | usgs.gov |
| 4/27/18 | 8:44 AM | 4.7 | 32.6 km | 10,000 m | 4km NE of Naguanagua, Venezuela | usgs.gov |
| 8/16/14 | 12:39 PM | 4 | 74.4 km | 7,700 m | 12km ENE of Ocumare de la Costa, Venezuela | usgs.gov |


データについて
このページのデータは、公開されている各種ツールやリソースを用いて推定されています。保証なしで提供されており、不正確な情報が含まれる可能性があります。ご自身の責任でご利用ください。