- 世界
- »
- CA
- »
- ケベック州
- »
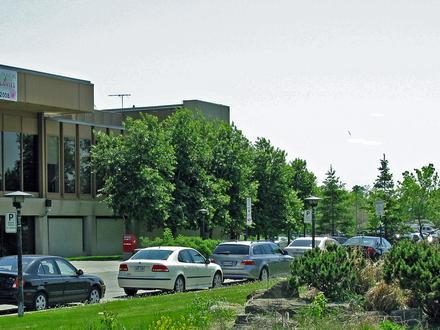
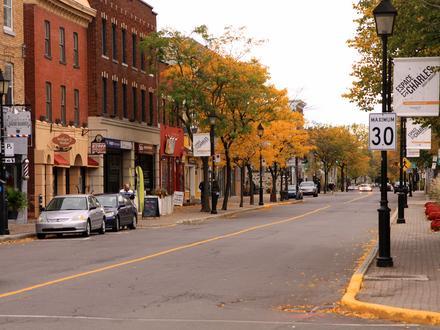
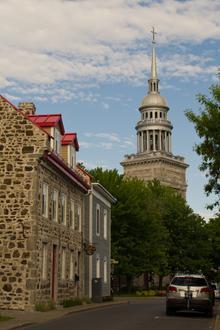
- Candiac、 ケベック州
Candiacのビジネス
産業
産業別事業分布 ショッピング: 16.6%
専門家のサービス: 13.5%
産業: 12.2%
ホームサービス: 10.8%
医療: 7.9%
レストラン: 5.5%
その他: 33.6%
| 業界の説明 | 事業所数 | ビジネスの平均年齢 | Googleの平均評価 | 住民1,000人あたりのビジネス |
|---|---|---|---|---|
| 車の修理 | 7 | 24.5 年 | 3.5 | 0.3 |
| ヘアサロン | 9 | 4.4 | 0.4 | |
| 美容院 | 16 | 25.8 年 | 4.4 | 0.7 |
| 行政 | 10 | 29.3 年 | 1.0 | 0.5 |
| ATM | 7 | 3.5 | 0.3 | |
| ローン会社 | 17 | 24.3 年 | 3.8 | 0.8 |
| 銀行 | 10 | 3.8 | 0.5 | |
| 食料雑貨品店・スーパーマーケット | 9 | 4.5 | 0.4 | |
| ゼネコン | 32 | 23.1 年 | 4.2 | 1.5 |
| 不動産 | 11 | 3.6 | 0.5 | |
| 引っ越し業者 | 9 | 24.1 年 | 4.1 | 0.4 |
| 電気設備 | 11 | 23.2 年 | 4.1 | 0.5 |
| その他の卸売 | 12 | 28.9 年 | 3.9 | 0.6 |
| トラクターや農機具 | 9 | 4.7 | 0.4 | |
| 倉庫・保管 | 9 | 23.3 年 | 4.1 | 0.4 |
| 建物の建設 | 26 | 26.2 年 | 4.1 | 1.2 |
| 建設資材の卸売 | 7 | 4.1 | 0.3 | |
| 機械の卸売 | 29 | 32.3 年 | 4.0 | 1.3 |
| 子供の保育・デイケア | 9 | 5.0 | 0.4 | |
| 保健医療 | 25 | 24.7 年 | 3.6 | 1.1 |
| 歯医者 | 9 | 4.9 | 0.4 | |
| 企業マネジメント | 13 | 26.4 年 | 5.0 | 0.6 |
| 特殊デザイン | 8 | 5.0 | 0.4 | |
| 経理 | 11 | 25.3 年 | 4.3 | 0.5 |
| スポーツ用品 | 10 | 4.7 | 0.5 | |
| 事務用品・文房具店 | 10 | 3.8 | 0.5 | |
| 服屋 | 8 | 3.7 | 0.4 | |
| 薬局・ドラッグストア | 15 | 36.7 年 | 4.5 | 0.7 |
| 金物店/ホームセンター | 10 | 3.9 | 0.5 | |
| 電気店 | 11 | 23.7 年 | 4.1 | 0.5 |
| 公共公園 | 13 | 4.5 | 0.6 |
| Candiac、 ケベック州の面積 | 18.7 km² |
| 人口 | 21787 |
| 男性人口 | 10824 (49.7%) |
| 女性人口 | 10963 (50.3%) |
| 1975から2015にかけての人口の変動 | +94.3% |
| 2000から2015にかけての人口の変動 | +25.2% |
| 平均年齢 | 37.4 |
| 男性平均年齢 | 37 |
| 女性の平均年齢 | 37.8 |
| 市外局番 | 450 |
| 地域 | Candiac |
| 現地時間 | 日曜日 2:05 |
| 時間帯 | アメリカ東部夏時間 |
| 緯度と経度 | 45.38338° / -73.51587° |
| 郵便番号 | J2W, J5R |
Candiac、 ケベック州 - 地図
Candiac、 ケベック州の人口
1975年から2015年まで| データ | 1975 | 1990 | 2000 | 2015 |
|---|---|---|---|---|
| 人口 | 11213 | 14785 | 17396 | 21787 |
| 人口密度 | 599.6 / km² | 790.6 / km² | 930.3 / km² | 1165 / km² |
2000から2015にかけてのCandiacの人口変動
2000年から2015年にかけての25.2%の増加| 場所 | 1975以来の変化 | 1990以来の変化 | 2000以来の変化 |
|---|---|---|---|
| Candiac、 ケベック州 | +94.3% | +47.4% | +25.2% |
| ケベック | +42.5% | +22.6% | +12.9% |
| カナダ | +55.8% | +30.2% | +17.2% |
Candiac、 ケベック州の年齢中央値
年齢中央値:37.4 年| 場所 | 平均年齢 | 年齢の中央値(女性) | 年齢の中央値(男性) |
|---|---|---|---|
| Candiac、 ケベック州 | 37.4 年 | 37.8 年 | 37 年 |
| ケベック | 42.2 年 | 43.2 年 | 41.1 年 |
| カナダ | 40.6 年 | 41.5 年 | 39.6 年 |
Candiac、 ケベック州の人口ピラミッド
年齢と性別による人口| 年齢 | 男性 | 女性 | 合計 |
|---|---|---|---|
| 5歳未満 | 806 | 802 | 1608 |
| 5-9 | 838 | 777 | 1615 |
| 10-14 | 825 | 712 | 1537 |
| 15-19 | 807 | 808 | 1615 |
| 20-24 | 575 | 537 | 1112 |
| 25-29 | 513 | 526 | 1040 |
| 30-34 | 696 | 813 | 1510 |
| 35-39 | 885 | 897 | 1783 |
| 40-44 | 937 | 1012 | 1949 |
| 45-49 | 962 | 957 | 1919 |
| 50-54 | 823 | 862 | 1686 |
| 55-59 | 617 | 657 | 1274 |
| 60-64 | 531 | 568 | 1099 |
| 65-69 | 451 | 451 | 903 |
| 70-74 | 269 | 255 | 524 |
| 75-79 | 173 | 171 | 345 |
| 80-84 | 75 | 108 | 184 |
| 85プラス | 42 | 50 | 92 |
Candiac、 ケベック州の人口密度
人口密度:1165 / km²| 場所 | 人口 | エリア | 人口密度 |
|---|---|---|---|
| Candiac、 ケベック州 | 21787 | 18.7 km² | 1165 / km² |
| ケベック | 7.0 ミリオン | 1,519,626.9 km² | 4.6 / km² |
| カナダ | 35.5 ミリオン | 9,875,295.4 km² | 3.6 / km² |
Candiac、 ケベック州の過去および将来の予測人口
1830から2100にかけての推定人口Sources:
1. JRC (European Commission's Joint Research Centre) work on the GHS built-up grid
2. CIESIN (Center for International Earth Science Information Network)
3. [リンク] Klein Goldewijk, K., Beusen, A., Doelman, J., and Stehfest, E.: Anthropogenic land use estimates for the Holocene – HYDE 3.2, Earth Syst. Sci. Data, 9, 927–953, https://doi.org/10.5194/essd-9-927-2017, 2017.
市外局番
Candiacのビジネスによって使用されている市外局番の割合 市外局番 450: 77.9%
市外局番 514: 19.3%
その他: 2.8%
Candiac、 ケベック州の価格によるビジネスの分布
安価な: 55.1%
適度な: 32.7%
非常に高価な: 8.2%
高価な: 4.1%
人間開発指数(HDI)
平均余命、教育、および一人当たり収入の統計的複合指数。Sources: [Link] Kummu, M., Taka, M. & Guillaume, J. Gridded global datasets for Gross Domestic Product and Human Development Index over 1990–2015. Sci Data 5, 180004 (2018) doi:10.1038/sdata.2018.4
Candiac、 ケベック州の二酸化炭素排出量
1人あたりの二酸化炭素(CO2)排出量(年間トン)| 場所 | CO2排出量 | 一人当たりのCO2排出量 | CO2排出強度 |
|---|---|---|---|
| Candiac、 ケベック州 | 332,561 s/t | 15.3 s/t | 17,784 米トン/km² |
| ケベック | 96,902,370 s/t | 13.9 s/t | 63.8 米トン/km² |
| カナダ | 521,999,336 s/t | 14.7 s/t | 52.9 米トン/km² |
Candiac、 ケベック州の二酸化炭素排出量
| 2013年の二酸化炭素排出量 (トン/年) | 332,561 s/t |
| 2013の人口1人あたりの二酸化炭素排出量 (トン/年) | 15.3 s/t |
| 2013年の二酸化炭素排出量強度 (トン/km²/年) | 17,784 米トン/km² |
自然災害リスク
10のうちの相対リスク| サイクロン | 中 (5) |
| 地震 | 中 (6) |
*特に洪水または地滑りに関するリスクは、地域全体に及ぶとは限りません。
Sources: 1. Dilley, M., R.S. Chen, U. Deichmann, A.L. Lerner-Lam, M. Arnold, J. Agwe, P. Buys, O. Kjekstad, B. Lyon, and G. Yetman. 2005. Natural Disaster Hotspots: A Global Risk Analysis. Washington, D.C.: World Bank. https://doi.org/10.1596/0-8213-5930-4.
2. Center for Hazards and Risk Research - CHRR - Columbia University, Center for International Earth Science Information Network - CIESIN - Columbia University. 2005. Global Earthquake Hazard Distribution - Peak Ground Acceleration. Palisades, NY: NASA Socioeconomic Data and Applications Center (SEDAC). https://doi.org/10.7927/H4BZ63ZS.
3. Center for Hazards and Risk Research - CHRR - Columbia University, Center for International Earth Science Information Network - CIESIN - Columbia University, International Bank for Reconstruction and Development - The World Bank, and United Nations Environment Programme Global Resource Information Database Geneva - UNEP/GRID-Geneva. 2005. Global Cyclone Hazard Frequency and Distribution. Palisades, NY: NASA Socioeconomic Data and Applications Center (SEDAC). https://doi.org/10.7927/H4CZ353K.
最近の近くの地震
マグニチュード3.0以上| 日付 | 時間 | 大きさ | 距離 | 深さ | 場所 | リンク |
|---|---|---|---|---|---|---|
| 2015/07/15 | 15:00 | 3.27 | 81.1 km | 10,230 m | 13km SSE of Hawkesbury, Canada | usgs.gov |
| 2012/11/06 | 1:05 | 3.74 | 88.7 km | 11,070 m | Ontario-Quebec border region, Canada | usgs.gov |
| 2012/10/09 | 21:19 | 3.93 | 45.6 km | 8,550 m | southern Quebec, Canada | usgs.gov |
| 2011/03/16 | 10:36 | 3.87 | 83.9 km | 10,000 m | Ontario-Quebec border region, Canada | usgs.gov |
| 2010/02/27 | 19:51 | 3.41 | 82.7 km | 7,370 m | Ontario-Quebec border region, Canada | usgs.gov |
| 2006/02/25 | 20:09 | 3.19 | 95.3 km | 13,540 m | Ontario-Quebec border region, Canada | usgs.gov |
| 2006/01/09 | 7:35 | 3.72 | 49.1 km | 12,690 m | southern Quebec, Canada | usgs.gov |
| 2005/04/07 | 21:32 | 3.4 | 97.6 km | 18,000 m | southern Quebec, Canada | usgs.gov |
| 2002/06/01 | 4:35 | 3.2 | 35.4 km | 18,000 m | southern Quebec, Canada | usgs.gov |
| 2002/05/24 | 16:46 | 3.1 | 98.5 km | 10,000 m | New York | usgs.gov |
Candiac、 ケベック州付近で発生した過去の地震の検索
最も早い日付 最新の日付
マグニチュード3.0以上 マグニチュード4.0以上 マグニチュード5.0以上

データについて
このページのデータは、公開されている多くのツールとリソースを使用して推定されています。保証なしで提供され、不正確な内容が含まれている可能性があります。自己責任。詳細については、 こちらをご覧ください。