- 世界
- »
- CA
- »
- ケベック州
- »
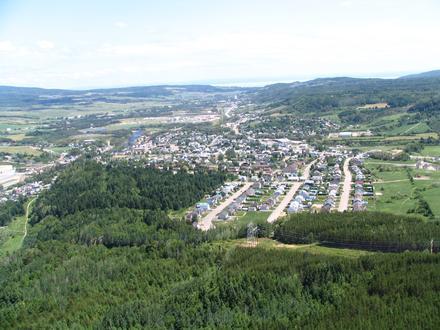
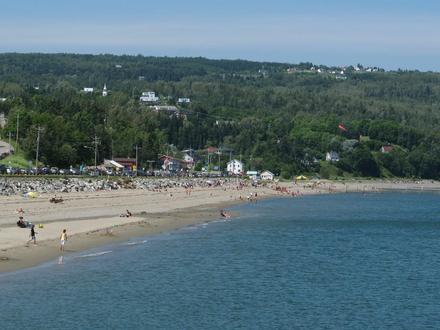
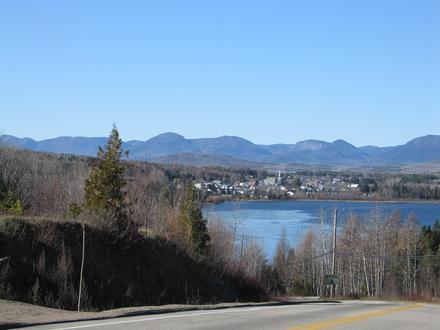
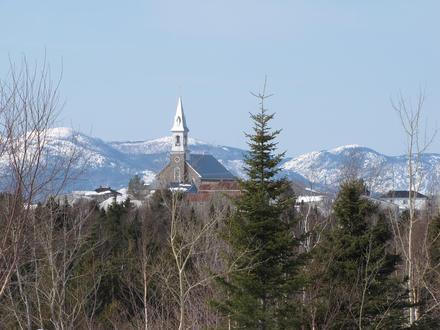
- La Malbaie、 ケベック州
La Malbaieのビジネス
産業
産業別事業分布 ショッピング: 18.4%
ホテルと旅行: 14.2%
レストラン: 8.4%
ホームサービス: 7.6%
産業: 7.5%
専門家のサービス: 5.8%
自動車: 5.7%
医療: 5.3%
その他: 27.1%
| 業界の説明 | 事業所数 | ビジネスの平均年齢 | Googleの平均評価 | 住民1,000人あたりのビジネス |
|---|---|---|---|---|
| 新車ディーラー | 7 | 31 年 | 4.3 | 0.8 |
| 自動車部品 | 11 | 34 年 | 4.3 | 1.2 |
| 車の修理 | 23 | 32.7 年 | 4.4 | 2.5 |
| ヘアサロン | 21 | 30 年 | 4.6 | 2.3 |
| 美容院 | 18 | 30.2 年 | 4.6 | 2.0 |
| 社会福祉 | 13 | 30.7 年 | 4.9 | 1.4 |
| 行政 | 14 | 32.9 年 | 4.3 | 1.6 |
| ローン会社 | 7 | 29 年 | 0.8 | |
| コンビニエンスストア | 7 | 5.0 | 0.8 | |
| 食料雑貨品店・スーパーマーケット | 15 | 30.5 年 | 4.3 | 1.7 |
| ゼネコン | 21 | 25.4 年 | 5.0 | 2.3 |
| 不動産 | 8 | 0.9 | ||
| その他の宿泊施設 | 74 | 30.2 年 | 4.3 | 8.2 |
| キャンプ場 | 9 | 4.3 | 1.0 | |
| ホテル・モーテル | 50 | 30.1 年 | 4.3 | 5.5 |
| 別荘、キャビン、リゾート | 13 | 30.3 年 | 4.5 | 1.4 |
| 旅行代理店 | 11 | 29 年 | 4.6 | 1.2 |
| 民宿 | 21 | 27.6 年 | 4.5 | 2.3 |
| その他の会員組織 | 10 | 27.3 年 | 3.4 | 1.1 |
| 建物の建設 | 13 | 24.2 年 | 5.0 | 1.4 |
| 保健医療 | 26 | 31.8 年 | 4.3 | 2.9 |
| 歯医者 | 9 | 1.0 | ||
| 郵便局 | 7 | 23.1 年 | 0.8 | |
| カフェ | 9 | 4.4 | 1.0 | |
| バー・パブ・居酒屋 | 11 | 29 年 | 4.2 | 1.2 |
| フレンチレストラン | 7 | 4.6 | 0.8 | |
| ショッピングその他 | 16 | 30.3 年 | 4.3 | 1.8 |
| 女性用衣料 | 10 | 26.8 年 | 4.2 | 1.1 |
| 家電製品・グッズ | 7 | 24.3 年 | 4.7 | 0.8 |
| 服屋 | 17 | 26 年 | 4.5 | 1.9 |
| 金物店/ホームセンター | 8 | 27.9 年 | 4.3 | 0.9 |
| 電気店 | 8 | 4.7 | 0.9 |
| La Malbaie、 ケベック州の面積 | 695.9 km² |
| 人口 | 9026 |
| 男性人口 | 4460 (49.4%) |
| 女性人口 | 4566 (50.6%) |
| 1975から2015にかけての人口の変動 | -3.5% |
| 2000から2015にかけての人口の変動 | -3.6% |
| 平均年齢 | 48.1 |
| 男性平均年齢 | 47.4 |
| 女性の平均年齢 | 48.8 |
| 市外局番 | 418 |
| 現地時間 | 日曜日 2:11 |
| 時間帯 | アメリカ東部夏時間 |
| 緯度と経度 | 47.654° / -70.15268° |
| 郵便番号 | G5A |
La Malbaie、 ケベック州 - 地図
La Malbaie、 ケベック州の人口
1975年から2015年まで| データ | 1975 | 1990 | 2000 | 2015 |
|---|---|---|---|---|
| 人口 | 9355 | 9508 | 9366 | 9026 |
| 人口密度 | 13.4 / km² | 13.7 / km² | 13.5 / km² | 13.0 / km² |
2000から2015にかけてのLa Malbaieの人口変動
2000年から2015年にかけての3.6%の低下| 場所 | 1975以来の変化 | 1990以来の変化 | 2000以来の変化 |
|---|---|---|---|
| La Malbaie、 ケベック州 | -3.5% | -5.1% | -3.6% |
| ケベック | +42.5% | +22.6% | +12.9% |
| カナダ | +55.8% | +30.2% | +17.2% |
La Malbaie、 ケベック州の年齢中央値
年齢中央値:48.1 年| 場所 | 平均年齢 | 年齢の中央値(女性) | 年齢の中央値(男性) |
|---|---|---|---|
| La Malbaie、 ケベック州 | 48.1 年 | 48.8 年 | 47.4 年 |
| ケベック | 42.2 年 | 43.2 年 | 41.1 年 |
| カナダ | 40.6 年 | 41.5 年 | 39.6 年 |
La Malbaie、 ケベック州の人口ピラミッド
年齢と性別による人口| 年齢 | 男性 | 女性 | 合計 |
|---|---|---|---|
| 5歳未満 | 214 | 204 | 419 |
| 5-9 | 184 | 184 | 368 |
| 10-14 | 244 | 214 | 458 |
| 15-19 | 244 | 224 | 469 |
| 20-24 | 244 | 219 | 464 |
| 25-29 | 234 | 204 | 439 |
| 30-34 | 234 | 255 | 490 |
| 35-39 | 199 | 240 | 439 |
| 40-44 | 280 | 265 | 545 |
| 45-49 | 321 | 357 | 678 |
| 50-54 | 442 | 458 | 901 |
| 55-59 | 418 | 399 | 817 |
| 60-64 | 388 | 367 | 755 |
| 65-69 | 295 | 301 | 597 |
| 70-74 | 214 | 205 | 419 |
| 75-79 | 148 | 158 | 307 |
| 80-84 | 102 | 158 | 260 |
| 85プラス | 56 | 153 | 210 |
La Malbaie、 ケベック州の人口密度
人口密度:13.0 / km²| 場所 | 人口 | エリア | 人口密度 |
|---|---|---|---|
| La Malbaie、 ケベック州 | 9026 | 695.9 km² | 13.0 / km² |
| ケベック | 7.0 ミリオン | 1,519,626.9 km² | 4.6 / km² |
| カナダ | 35.5 ミリオン | 9,875,295.4 km² | 3.6 / km² |
La Malbaie、 ケベック州の歴史的人口
1730から2015にかけての推定人口Sources:
1. JRC (European Commission's Joint Research Centre) work on the GHS built-up grid
2. CIESIN (Center for International Earth Science Information Network)
3. [リンク] Klein Goldewijk, K., Beusen, A., Doelman, J., and Stehfest, E.: Anthropogenic land use estimates for the Holocene – HYDE 3.2, Earth Syst. Sci. Data, 9, 927–953, https://doi.org/10.5194/essd-9-927-2017, 2017.
La Malbaie、 ケベック州の価格によるビジネスの分布
適度な: 31.7%
高価な: 31.7%
安価な: 26.8%
非常に高価な: 9.8%
人間開発指数(HDI)
平均余命、教育、および一人当たり収入の統計的複合指数。Sources: [Link] Kummu, M., Taka, M. & Guillaume, J. Gridded global datasets for Gross Domestic Product and Human Development Index over 1990–2015. Sci Data 5, 180004 (2018) doi:10.1038/sdata.2018.4
La Malbaie、 ケベック州の二酸化炭素排出量
1人あたりの二酸化炭素(CO2)排出量(年間トン)| 場所 | CO2排出量 | 一人当たりのCO2排出量 | CO2排出強度 |
|---|---|---|---|
| La Malbaie、 ケベック州 | 79,829 s/t | 8.84 s/t | 114.7 米トン/km² |
| ケベック | 96,902,370 s/t | 13.9 s/t | 63.8 米トン/km² |
| カナダ | 521,999,336 s/t | 14.7 s/t | 52.9 米トン/km² |
La Malbaie、 ケベック州の二酸化炭素排出量
| 2013年の二酸化炭素排出量 (トン/年) | 79,829 s/t |
| 2013の人口1人あたりの二酸化炭素排出量 (トン/年) | 8.84 s/t |
| 2013年の二酸化炭素排出量強度 (トン/km²/年) | 114.7 米トン/km² |
自然災害リスク
10のうちの相対リスク| 地震 | 高 (9.9) |
*特に洪水または地滑りに関するリスクは、地域全体に及ぶとは限りません。
Sources: 1. Dilley, M., R.S. Chen, U. Deichmann, A.L. Lerner-Lam, M. Arnold, J. Agwe, P. Buys, O. Kjekstad, B. Lyon, and G. Yetman. 2005. Natural Disaster Hotspots: A Global Risk Analysis. Washington, D.C.: World Bank. https://doi.org/10.1596/0-8213-5930-4.
2. Center for Hazards and Risk Research - CHRR - Columbia University, Center for International Earth Science Information Network - CIESIN - Columbia University. 2005. Global Earthquake Hazard Distribution - Peak Ground Acceleration. Palisades, NY: NASA Socioeconomic Data and Applications Center (SEDAC). https://doi.org/10.7927/H4BZ63ZS.
最近の近くの地震
マグニチュード3.0以上| 日付 | 時間 | 大きさ | 距離 | 深さ | 場所 | リンク |
|---|---|---|---|---|---|---|
| 2018/01/04 | 7:42 | 3.4 | 96 km | 18,000 m | 18km WSW of Montmagny, Canada | usgs.gov |
| 2015/09/12 | 17:45 | 3.1 | 29.9 km | 11,290 m | 10km E of Baie-Saint-Paul, Canada | usgs.gov |
| 2015/06/28 | 2:15 | 3.3 | 29.3 km | 7,400 m | 5km NNW of La Pocatiere, Canada | usgs.gov |
| 2015/01/20 | 21:31 | 3.7 | 31.8 km | 14,500 m | 11km WNW of La Pocatiere, Canada | usgs.gov |
| 2013/12/10 | 23:47 | 3.4 | 51.4 km | 12,500 m | 25km SSE of Baie-Saint-Paul, Canada | usgs.gov |
| 2013/07/11 | 13:16 | 4.4 | 19 km | 14,900 m | St. Lawrence Valley region, Quebec, Canada | usgs.gov |
| 2012/12/12 | 9:46 | 4.4 | 16.5 km | 5,300 m | St. Lawrence Valley region, Quebec, Canada | usgs.gov |
| 2012/08/04 | 11:27 | 3.8 | 57.5 km | 18,000 m | St. Lawrence Valley region, Quebec, Canada | usgs.gov |
| 2012/02/24 | 14:47 | 4 | 6.9 km | 1,400 m | St. Lawrence Valley region, Quebec, Canada | usgs.gov |
| 2011/11/29 | 9:02 | 3.4 | 13.7 km | 14,000 m | St. Lawrence Valley region, Quebec, Canada | usgs.gov |
La Malbaie、 ケベック州付近で発生した過去の地震の検索
最も早い日付 最新の日付
マグニチュード3.0以上 マグニチュード4.0以上 マグニチュード5.0以上
データについて
このページのデータは、公開されている多くのツールとリソースを使用して推定されています。保証なしで提供され、不正確な内容が含まれている可能性があります。自己責任。詳細については、 こちらをご覧ください。