- 世界
- »
- DE
- »
- バイエルン州
- »
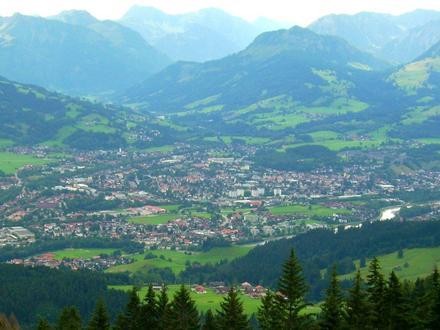
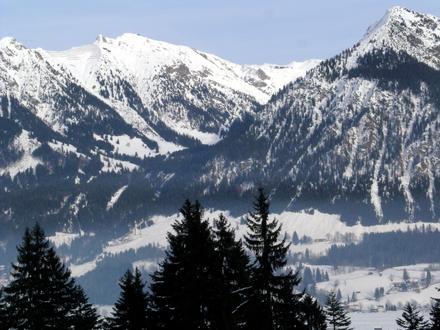
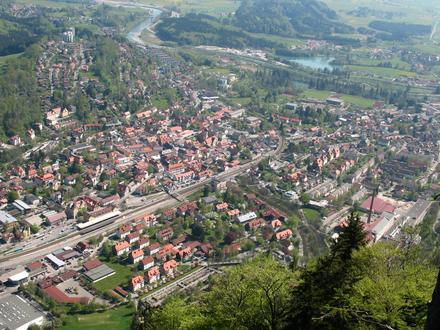
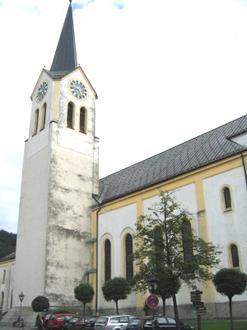
- Fischen、 バイエルン州
Fischenのビジネス
産業
産業別事業分布 ホテルと旅行: 32.8%
食品: 13.1%
ショッピング: 11.7%
ホームサービス: 9%
その他: 33.4%
| 業界の説明 | 事業所数 | Googleの平均評価 | 住民1,000人あたりのビジネス |
|---|---|---|---|
| 美容院 | 5 | 4.5 | 3.5 |
| シーフード店 | 9 | 4.0 | 6.3 |
| 食料雑貨品店・スーパーマーケット | 8 | 4.1 | 5.6 |
| ゼネコン | 6 | 5.0 | 4.2 |
| マンション | 6 | 4.9 | 4.2 |
| 不動産 | 8 | 4.9 | 5.6 |
| その他の宿泊施設 | 186 | 4.5 | 129.5 |
| ホステル | 42 | 4.5 | 29.2 |
| ホテル・モーテル | 35 | 4.4 | 24.4 |
| 別荘、キャビン、リゾート | 43 | 4.5 | 29.9 |
| 旅行代理店 | 38 | 4.5 | 26.5 |
| 民宿 | 25 | 4.4 | 17.4 |
| 保健医療 | 11 | 5.0 | 7.7 |
| カフェ | 13 | 4.4 | 9.1 |
| ドイツ料理レストラン | 9 | 4.5 | 6.3 |
| バー・パブ・居酒屋 | 5 | 4.5 | 3.5 |
| 服屋 | 6 | 4.4 | 4.2 |
| Fischen、 バイエルン州の面積 | 0.74 km² |
| 人口 | 1436 |
| 男性人口 | 687 (47.9%) |
| 女性人口 | 749 (52.1%) |
| 1975から2015にかけての人口の変動 | -26.2% |
| 2000から2015にかけての人口の変動 | -5.1% |
| 平均年齢 | 45.2 |
| 男性平均年齢 | 44.2 |
| 女性の平均年齢 | 46.2 |
| 市外局番 | 8322, 8326 |
| 地域 | Au, Berg, Langenwang, Maderhalm, Oberthalhofen, Unterthalhofen, Weiler |
| 現地時間 | 金曜日 17:38 |
| 時間帯 | 中央ヨーロッパ夏時間 |
| 緯度と経度 | 47.45852° / 10.27198° |
Fischen、 バイエルン州 - 地図
Fischen、 バイエルン州の人口
1975年から2015年まで| データ | 1975 | 1990 | 2000 | 2015 |
|---|---|---|---|---|
| 人口 | 1947 | 1928 | 1513 | 1436 |
| 人口密度 | 2631 / km² | 2605 / km² | 2044 / km² | 1940 / km² |
2000から2015にかけてのFischenの人口変動
2000年から2015年にかけての5.1%の低下| 場所 | 1975以来の変化 | 1990以来の変化 | 2000以来の変化 |
|---|---|---|---|
| Fischen、 バイエルン州 | -26.2% | -25.5% | -5.1% |
| バイエルン州 | +18.8% | +11.8% | +3.9% |
| ドイツ | +2.6% | +2.2% | -1.5% |
Fischen、 バイエルン州の年齢中央値
年齢中央値:45.2 年| 場所 | 平均年齢 | 年齢の中央値(女性) | 年齢の中央値(男性) |
|---|---|---|---|
| Fischen、 バイエルン州 | 45.2 年 | 46.2 年 | 44.2 年 |
| バイエルン州 | 43.9 年 | 44.9 年 | 42.8 年 |
| ドイツ | 44.8 年 | 46 年 | 43.6 年 |
Fischen、 バイエルン州の人口ピラミッド
年齢と性別による人口| 年齢 | 男性 | 女性 | 合計 |
|---|---|---|---|
| 5歳未満 | 29 | 28 | 57 |
| 5-9 | 33 | 33 | 66 |
| 10-14 | 41 | 40 | 81 |
| 15-19 | 44 | 42 | 86 |
| 20-24 | 40 | 37 | 77 |
| 25-29 | 35 | 36 | 72 |
| 30-34 | 35 | 40 | 75 |
| 35-39 | 40 | 43 | 84 |
| 40-44 | 57 | 60 | 118 |
| 45-49 | 63 | 64 | 128 |
| 50-54 | 54 | 57 | 112 |
| 55-59 | 43 | 48 | 91 |
| 60-64 | 43 | 48 | 91 |
| 65-69 | 40 | 43 | 84 |
| 70-74 | 42 | 47 | 90 |
| 75-79 | 25 | 31 | 56 |
| 80-84 | 15 | 25 | 40 |
| 85プラス | 10 | 26 | 36 |
Fischen、 バイエルン州の人口密度
人口密度:1940 / km²| 場所 | 人口 | エリア | 人口密度 |
|---|---|---|---|
| Fischen、 バイエルン州 | 1436 | 0.74 km² | 1940 / km² |
| バイエルン州 | 12.7 ミリオン | 70,548.3 km² | 179.5 / km² |
| ドイツ | 80.7 ミリオン | 358,179.8 km² | 225.2 / km² |
Fischen、 バイエルン州の過去および将来の予測人口
2100以前の古代の推定人口Sources:
1. JRC (European Commission's Joint Research Centre) work on the GHS built-up grid
2. CIESIN (Center for International Earth Science Information Network)
3. [リンク] Klein Goldewijk, K., Beusen, A., Doelman, J., and Stehfest, E.: Anthropogenic land use estimates for the Holocene – HYDE 3.2, Earth Syst. Sci. Data, 9, 927–953, https://doi.org/10.5194/essd-9-927-2017, 2017.
地域
Fischenの地区別のビジネスの分布 Langenwang: 25.3%
Berg: 21.5%
Au: 16.5%
Maderhalm: 11.4%
Weiler: 10.8%
Oberthalhofen: 5.7%
Unterthalhofen: 5.7%
その他: 3.2%
Fischen、 バイエルン州の価格によるビジネスの分布
適度な: 52.6%
安価な: 42.1%
非常に高価な: 5.3%
人間開発指数(HDI)
平均余命、教育、および一人当たり収入の統計的複合指数。Sources: [Link] Kummu, M., Taka, M. & Guillaume, J. Gridded global datasets for Gross Domestic Product and Human Development Index over 1990–2015. Sci Data 5, 180004 (2018) doi:10.1038/sdata.2018.4
Fischen、 バイエルン州の二酸化炭素排出量
1人あたりの二酸化炭素(CO2)排出量(年間トン)| 場所 | CO2排出量 | 一人当たりのCO2排出量 | CO2排出強度 |
|---|---|---|---|
| Fischen、 バイエルン州 | 14,106 s/t | 9.82 s/t | 19,062 米トン/km² |
| バイエルン州 | 124,278,406 s/t | 9.81 s/t | 1,761 米トン/km² |
| ドイツ | 755,339,039 s/t | 9.36 s/t | 2,108 米トン/km² |
Fischen、 バイエルン州の二酸化炭素排出量
| 2013年の二酸化炭素排出量 (トン/年) | 14,106 s/t |
| 2013の人口1人あたりの二酸化炭素排出量 (トン/年) | 9.82 s/t |
| 2013年の二酸化炭素排出量強度 (トン/km²/年) | 19,062 米トン/km² |
自然災害リスク
10のうちの相対リスク| 洪水 | 高 (8) |
| 地震 | 中 (4) |
*特に洪水または地滑りに関するリスクは、地域全体に及ぶとは限りません。
Sources: 1. Dilley, M., R.S. Chen, U. Deichmann, A.L. Lerner-Lam, M. Arnold, J. Agwe, P. Buys, O. Kjekstad, B. Lyon, and G. Yetman. 2005. Natural Disaster Hotspots: A Global Risk Analysis. Washington, D.C.: World Bank. https://doi.org/10.1596/0-8213-5930-4.
2. Center for Hazards and Risk Research - CHRR - Columbia University, Center for International Earth Science Information Network - CIESIN - Columbia University. 2005. Global Earthquake Hazard Distribution - Peak Ground Acceleration. Palisades, NY: NASA Socioeconomic Data and Applications Center (SEDAC). https://doi.org/10.7927/H4BZ63ZS.
3. Center for Hazards and Risk Research - CHRR - Columbia University, Center for International Earth Science Information Network - CIESIN - Columbia University. 2005. Global Flood Hazard Frequency and Distribution. Palisades, NY: NASA Socioeconomic Data and Applications Center (SEDAC). https://doi.org/10.7927/H4668B3D.
最近の近くの地震
マグニチュード3.0以上| 日付 | 時間 | 大きさ | 距離 | 深さ | 場所 | リンク |
|---|---|---|---|---|---|---|
| 2018/01/31 | 17:47 | 3.8 | 39.9 km | 5,000 m | 4km N of Innerbraz, Austria | usgs.gov |
| 2018/01/17 | 11:07 | 4 | 40.8 km | 10,000 m | 2km NE of Innerbraz, Austria | usgs.gov |
| 2007/10/15 | 9:25 | 3.2 | 24 km | 14,300 m | Austria | usgs.gov |
| 2007/05/19 | 9:19 | 4.1 | 39.2 km | 4,000 m | Austria | usgs.gov |
| 2005/07/04 | 16:02 | 3.3 | 28.4 km | 10,000 m | Austria | usgs.gov |
| 2004/11/04 | 11:11 | 3.2 | 54.7 km | 5,000 m | Austria | usgs.gov |
| 2004/04/17 | 20:21 | 3.1 | 46.6 km | 33,000 m | Germany | usgs.gov |
| 2004/01/09 | 18:51 | 3.2 | 51.4 km | 11,000 m | Austria | usgs.gov |
| 2003/11/09 | 4:06 | 3.1 | 54 km | 10,000 m | Austria | usgs.gov |
| 2003/01/29 | 0:00 | 3.7 | 17.3 km | 10,000 m | Austria | usgs.gov |
Fischen、 バイエルン州付近で発生した過去の地震の検索
最も早い日付 最新の日付
マグニチュード3.0以上 マグニチュード4.0以上 マグニチュード5.0以上
データについて
このページのデータは、公開されている多くのツールとリソースを使用して推定されています。保証なしで提供され、不正確な内容が含まれている可能性があります。自己責任。詳細については、 こちらをご覧ください。