- 世界
- »
- DE
- »
- バイエルン州
- »
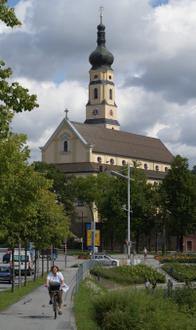
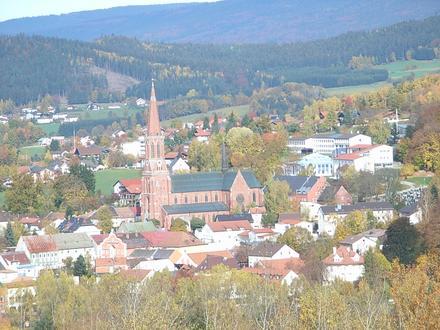
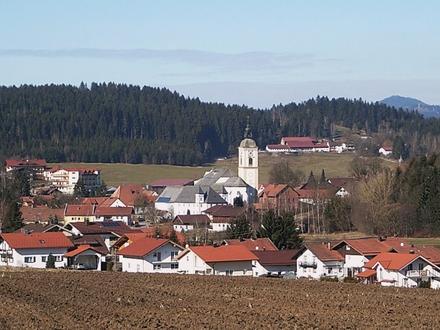
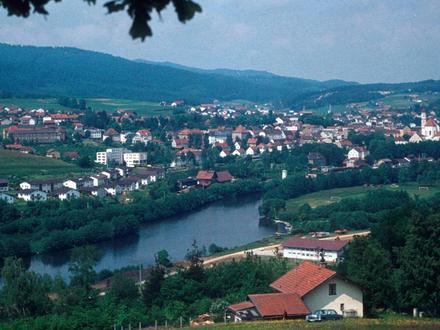
- Regen、 バイエルン州
Regenのビジネス
産業
産業別事業分布 ショッピング: 18.8%
専門家のサービス: 10.8%
産業: 10.1%
医療: 8.8%
ホテルと旅行: 8%
ホームサービス: 7.1%
レストラン: 6.2%
金融サービス: 5.4%
食品: 5.3%
その他: 19.6%
| 業界の説明 | 事業所数 | Googleの平均評価 | 住民1,000人あたりのビジネス |
|---|---|---|---|
| 車の修理 | 23 | 4.5 | 3.7 |
| ヘアサロン | 11 | 4.7 | 1.8 |
| 美容院 | 15 | 4.6 | 2.4 |
| ATM | 12 | 4.9 | 2.0 |
| ローン会社 | 25 | 4.7 | 4.1 |
| 銀行 | 12 | 4.8 | 2.0 |
| 食料雑貨品店・スーパーマーケット | 31 | 4.3 | 5.0 |
| ゼネコン | 17 | 4.5 | 2.8 |
| 不動産 | 12 | 3.4 | 2.0 |
| 台所や風呂や改造内閣 | 11 | 4.7 | 1.8 |
| 配管設置・修理 | 9 | 4.8 | 1.5 |
| 電気設備 | 13 | 4.3 | 2.1 |
| その他の宿泊施設 | 44 | 4.4 | 7.2 |
| ホテル・モーテル | 15 | 4.3 | 2.4 |
| その他の会員組織 | 12 | 4.4 | 2.0 |
| 保健医療 | 61 | 3.8 | 9.9 |
| 歯医者 | 9 | 5.0 | 1.5 |
| 弁護士 | 15 | 5.0 | 2.4 |
| カフェ | 11 | 4.0 | 1.8 |
| 家電製品・グッズ | 10 | 4.3 | 1.6 |
| 服屋 | 15 | 4.2 | 2.4 |
| 薬局・ドラッグストア | 12 | 4.5 | 2.0 |
| 金物店/ホームセンター | 14 | 4.3 | 2.3 |
| 電気店 | 14 | 4.3 | 2.3 |
| Regen、 バイエルン州の面積 | 4.95 km² |
| 人口 | 6143 |
| 男性人口 | 3018 (49.1%) |
| 女性人口 | 3125 (50.9%) |
| 1975から2015にかけての人口の変動 | -34.8% |
| 2000から2015にかけての人口の変動 | -15.1% |
| 平均年齢 | 45.5 |
| 男性平均年齢 | 44.1 |
| 女性の平均年齢 | 46.9 |
| 市外局番 | 9920, 9921, 9922 |
| 地域 | Bettmannsäge, Bärndorf, March, Metten, Schweinhütt, Weißenstein, Wieshof |
| 現地時間 | 金曜日 4:46 |
| 時間帯 | 中央ヨーロッパ夏時間 |
| 緯度と経度 | 48.9719° / 13.12824° |
| 郵便番号 | 94209 |
Regen、 バイエルン州 - 地図
Regen、 バイエルン州の人口
1975年から2015年まで| データ | 1975 | 1990 | 2000 | 2015 |
|---|---|---|---|---|
| 人口 | 9421 | 7749 | 7234 | 6143 |
| 人口密度 | 1903 / km² | 1565 / km² | 1461 / km² | 1241 / km² |
2000から2015にかけてのRegenの人口変動
2000年から2015年にかけての15.1%の低下| 場所 | 1975以来の変化 | 1990以来の変化 | 2000以来の変化 |
|---|---|---|---|
| Regen、 バイエルン州 | -34.8% | -20.7% | -15.1% |
| バイエルン州 | +18.8% | +11.8% | +3.9% |
| ドイツ | +2.6% | +2.2% | -1.5% |
Regen、 バイエルン州の年齢中央値
年齢中央値:45.5 年| 場所 | 平均年齢 | 年齢の中央値(女性) | 年齢の中央値(男性) |
|---|---|---|---|
| Regen、 バイエルン州 | 45.5 年 | 46.9 年 | 44.1 年 |
| バイエルン州 | 43.9 年 | 44.9 年 | 42.8 年 |
| ドイツ | 44.8 年 | 46 年 | 43.6 年 |
Regen、 バイエルン州の人口ピラミッド
年齢と性別による人口| 年齢 | 男性 | 女性 | 合計 |
|---|---|---|---|
| 5歳未満 | 121 | 105 | 226 |
| 5-9 | 139 | 133 | 272 |
| 10-14 | 164 | 156 | 320 |
| 15-19 | 179 | 164 | 343 |
| 20-24 | 192 | 170 | 362 |
| 25-29 | 173 | 155 | 329 |
| 30-34 | 165 | 163 | 328 |
| 35-39 | 182 | 180 | 363 |
| 40-44 | 236 | 238 | 475 |
| 45-49 | 261 | 263 | 525 |
| 50-54 | 263 | 257 | 521 |
| 55-59 | 229 | 224 | 454 |
| 60-64 | 201 | 203 | 404 |
| 65-69 | 142 | 141 | 283 |
| 70-74 | 165 | 206 | 371 |
| 75-79 | 105 | 153 | 259 |
| 80-84 | 69 | 123 | 193 |
| 85プラス | 32 | 93 | 125 |
Regen、 バイエルン州の人口密度
人口密度:1241 / km²| 場所 | 人口 | エリア | 人口密度 |
|---|---|---|---|
| Regen、 バイエルン州 | 6143 | 4.95 km² | 1241 / km² |
| バイエルン州 | 12.7 ミリオン | 70,548.3 km² | 179.5 / km² |
| ドイツ | 80.7 ミリオン | 358,179.8 km² | 225.2 / km² |
Regen、 バイエルン州の予測人口
1975から2100にかけての推定人口Sources:
1. JRC (European Commission's Joint Research Centre) work on the GHS built-up grid
2. CIESIN (Center for International Earth Science Information Network)
3. [リンク] Klein Goldewijk, K., Beusen, A., Doelman, J., and Stehfest, E.: Anthropogenic land use estimates for the Holocene – HYDE 3.2, Earth Syst. Sci. Data, 9, 927–953, https://doi.org/10.5194/essd-9-927-2017, 2017.
地域
Regenの地区別のビジネスの分布 Wieshof: 20.8%
Bärndorf: 14%
March: 13.2%
Schweinhütt: 9.6%
Metten: 6.4%
Weißenstein: 5.6%
その他: 30.4%
人間開発指数(HDI)
平均余命、教育、および一人当たり収入の統計的複合指数。Sources: [Link] Kummu, M., Taka, M. & Guillaume, J. Gridded global datasets for Gross Domestic Product and Human Development Index over 1990–2015. Sci Data 5, 180004 (2018) doi:10.1038/sdata.2018.4
Regen、 バイエルン州の二酸化炭素排出量
1人あたりの二酸化炭素(CO2)排出量(年間トン)| 場所 | CO2排出量 | 一人当たりのCO2排出量 | CO2排出強度 |
|---|---|---|---|
| Regen、 バイエルン州 | 55,557 s/t | 9.04 s/t | 11,223 米トン/km² |
| バイエルン州 | 124,278,406 s/t | 9.81 s/t | 1,761 米トン/km² |
| ドイツ | 755,339,039 s/t | 9.36 s/t | 2,108 米トン/km² |
Regen、 バイエルン州の二酸化炭素排出量
| 2013年の二酸化炭素排出量 (トン/年) | 55,557 s/t |
| 2013の人口1人あたりの二酸化炭素排出量 (トン/年) | 9.04 s/t |
| 2013年の二酸化炭素排出量強度 (トン/km²/年) | 11,223 米トン/km² |
自然災害リスク
10のうちの相対リスク| 洪水 | 高 (9) |
| 地震 | 低 (2) |
*特に洪水または地滑りに関するリスクは、地域全体に及ぶとは限りません。
Sources: 1. Dilley, M., R.S. Chen, U. Deichmann, A.L. Lerner-Lam, M. Arnold, J. Agwe, P. Buys, O. Kjekstad, B. Lyon, and G. Yetman. 2005. Natural Disaster Hotspots: A Global Risk Analysis. Washington, D.C.: World Bank. https://doi.org/10.1596/0-8213-5930-4.
2. Center for Hazards and Risk Research - CHRR - Columbia University, Center for International Earth Science Information Network - CIESIN - Columbia University. 2005. Global Earthquake Hazard Distribution - Peak Ground Acceleration. Palisades, NY: NASA Socioeconomic Data and Applications Center (SEDAC). https://doi.org/10.7927/H4BZ63ZS.
3. Center for Hazards and Risk Research - CHRR - Columbia University, Center for International Earth Science Information Network - CIESIN - Columbia University. 2005. Global Flood Hazard Frequency and Distribution. Palisades, NY: NASA Socioeconomic Data and Applications Center (SEDAC). https://doi.org/10.7927/H4668B3D.
最近の近くの地震
マグニチュード3.0以上| 日付 | 時間 | 大きさ | 距離 | 深さ | 場所 | リンク |
|---|---|---|---|---|---|---|
| 2008/08/12 | 10:25 | 3.8 | 98.2 km | 10,000 m | Austria | usgs.gov |
| 2005/10/06 | 0:23 | 3.8 | 84.5 km | 10,000 m | Austria | usgs.gov |
| 2000/06/15 | 14:56 | 3.2 | 99.8 km | 5,000 m | Czech Republic | usgs.gov |
| 2000/06/14 | 7:30 | 3.1 | 92.3 km | 10,000 m | Czech Republic | usgs.gov |
| 1998/12/09 | 19:24 | 3.1 | 81.1 km | 5,000 m | Austria | usgs.gov |
| 1987/12/19 | 16:08 | 3.4 | 84 km | 10,000 m | Austria | usgs.gov |
| 1983/04/29 | 9:59 | 3.1 | 69.6 km | 10,000 m | Czech Republic | usgs.gov |
| 1980/09/12 | 2:37 | 3.5 | 96.5 km | 10,000 m | Czech Republic | usgs.gov |
データについて
このページのデータは、公開されている多くのツールとリソースを使用して推定されています。保証なしで提供され、不正確な内容が含まれている可能性があります。自己責任。詳細については、 こちらをご覧ください。