- 世界
- »
- GB
- »
- イングランド
- »
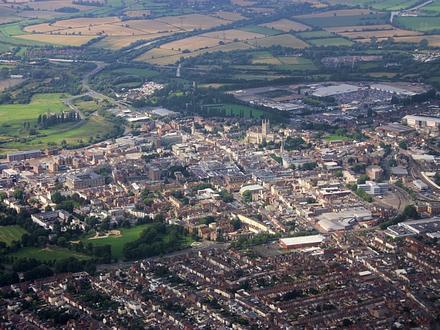
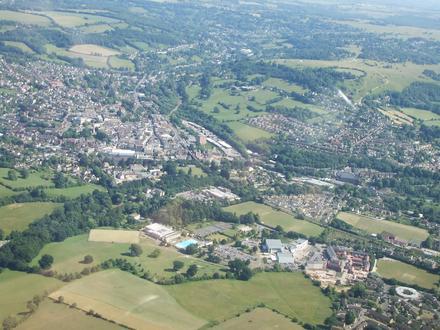
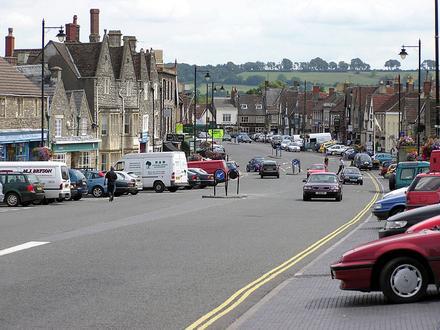
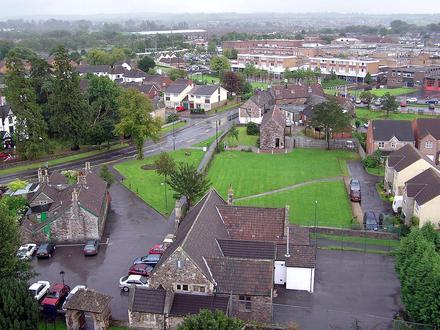
- Dursley、 イングランド
Dursleyのビジネス
産業
産業別事業分布 ショッピング: 17.4%
専門家のサービス: 13.1%
産業: 12%
ホームサービス: 10.6%
食品: 6%
医療: 5.7%
その他: 35.2%
| 業界の説明 | 事業所数 | ビジネスの平均年齢 | Googleの平均評価 | 住民1,000人あたりのビジネス |
|---|---|---|---|---|
| 新車ディーラー | 7 | 4.3 | 1.1 | |
| 自動車部品 | 8 | 4.3 | 1.3 | |
| 車の修理 | 16 | 19.2 年 | 4.2 | 2.6 |
| ヘアサロン | 8 | 4.7 | 1.3 | |
| 美容院 | 12 | 4.7 | 2.0 | |
| 保育園・幼稚園 | 7 | 1.1 | ||
| 小学校 | 10 | 4.5 | 1.6 | |
| 自動車教習所 | 7 | 4.9 | 1.1 | |
| ローン会社 | 8 | 1.3 | ||
| 食料雑貨品店・スーパーマーケット | 44 | 19.9 年 | 4.1 | 7.2 |
| その他の建設 | 8 | 1.3 | ||
| ゼネコン | 29 | 4.6 | 4.7 | |
| 不動産 | 8 | 4.5 | 1.3 | |
| 塗装・塗装請負会社 | 7 | 5.0 | 1.1 | |
| 配管設置・修理 | 7 | 4.2 | 1.1 | |
| その他の宿泊施設 | 17 | 4.3 | 2.8 | |
| ホテル・モーテル | 8 | 4.3 | 1.3 | |
| 民宿 | 8 | 4.3 | 1.3 | |
| その他の会員組織 | 7 | 4.0 | 1.1 | |
| トラクターや農機具 | 25 | 4.8 | 4.1 | |
| 建物の建設 | 10 | 4.5 | 1.6 | |
| 機械の卸売 | 12 | 21.7 年 | 4.6 | 2.0 |
| 保健医療 | 44 | 4.2 | 7.2 | |
| アーキテクツ | 7 | 1.1 | ||
| 企業マネジメント | 14 | 4.9 | 2.3 | |
| 技術的構成サービス | 15 | 4.9 | 2.5 | |
| 特殊デザイン | 9 | 4.9 | 1.5 | |
| 教会 | 11 | 4.4 | 1.8 | |
| バー・パブ・居酒屋 | 12 | 4.3 | 2.0 | |
| ファーストフードレストラン | 7 | 4.3 | 1.1 | |
| ギフト・カード・パーティー商品 | 13 | 4.7 | 2.1 | |
| ショッピングその他 | 13 | 3.7 | 2.1 | |
| 家電製品・グッズ | 8 | 4.5 | 1.3 | |
| 電気店 | 17 | 36.8 年 | 4.2 | 2.8 |
| Dursley、 イングランドの面積 | 4.627 km² |
| 人口 | 6117 |
| 男性人口 | 3027 (49.5%) |
| 女性人口 | 3090 (50.5%) |
| 1975から2015にかけての人口の変動 | +4.3% |
| 2000から2015にかけての人口の変動 | +5.3% |
| 平均年齢 | 40.8 |
| 男性平均年齢 | 40.3 |
| 女性の平均年齢 | 41.2 |
| 市外局番 | 1453 |
| 地域 | Cam, Coaley, North Nibley, Town Centre, Uley |
| 現地時間 | 日曜日 7:03 |
| 時間帯 | 英国夏時間 |
| 緯度と経度 | 51.68139° / -2.35333° |
| 郵便番号 | GL11, GL12, GL13 |
Dursley、 イングランド - 地図
Dursley、 イングランドの人口
1975年から2015年まで| データ | 1975 | 1990 | 2000 | 2015 |
|---|---|---|---|---|
| 人口 | 5866 | 5777 | 5809 | 6117 |
| 人口密度 | 1267 / km² | 1248 / km² | 1255 / km² | 1322 / km² |
2000から2015にかけてのDursleyの人口変動
2000年から2015年にかけての5.3%の増加| 場所 | 1975以来の変化 | 1990以来の変化 | 2000以来の変化 |
|---|---|---|---|
| Dursley、 イングランド | +4.3% | +5.9% | +5.3% |
| Gloucestershire | +10.6% | +10% | +7.8% |
| イギリス | +15.2% | +13.3% | +9.9% |
Dursley、 イングランドの年齢中央値
年齢中央値:40.8 年| 場所 | 平均年齢 | 年齢の中央値(女性) | 年齢の中央値(男性) |
|---|---|---|---|
| Dursley、 イングランド | 40.8 年 | 41.2 年 | 40.3 年 |
| Gloucestershire | 41.9 年 | 42.9 年 | 40.9 年 |
| イギリス | 39.6 年 | 40.6 年 | 38.5 年 |
Dursley、 イングランドの人口ピラミッド
年齢と性別による人口| 年齢 | 男性 | 女性 | 合計 |
|---|---|---|---|
| 5歳未満 | 200 | 198 | 399 |
| 5-9 | 195 | 174 | 369 |
| 10-14 | 162 | 173 | 336 |
| 15-19 | 162 | 163 | 326 |
| 20-24 | 139 | 174 | 313 |
| 25-29 | 178 | 174 | 353 |
| 30-34 | 232 | 211 | 444 |
| 35-39 | 228 | 224 | 452 |
| 40-44 | 261 | 234 | 495 |
| 45-49 | 218 | 214 | 433 |
| 50-54 | 209 | 190 | 400 |
| 55-59 | 185 | 167 | 352 |
| 60-64 | 166 | 170 | 337 |
| 65-69 | 153 | 168 | 321 |
| 70-74 | 127 | 131 | 259 |
| 75-79 | 93 | 121 | 214 |
| 80-84 | 62 | 89 | 152 |
| 85プラス | 56 | 114 | 171 |
Dursley、 イングランドの人口密度
人口密度:1322 / km²| 場所 | 人口 | エリア | 人口密度 |
|---|---|---|---|
| Dursley、 イングランド | 6117 | 4.627 km² | 1322 / km² |
| Gloucestershire | 875799 | 3,243.5 km² | 270.0 / km² |
| イギリス | 64.5 ミリオン | 247,916.6 km² | 260.3 / km² |
Dursley、 イングランドの歴史的人口
900から2015にかけての推定人口Sources:
1. JRC (European Commission's Joint Research Centre) work on the GHS built-up grid
2. CIESIN (Center for International Earth Science Information Network)
3. [リンク] Klein Goldewijk, K., Beusen, A., Doelman, J., and Stehfest, E.: Anthropogenic land use estimates for the Holocene – HYDE 3.2, Earth Syst. Sci. Data, 9, 927–953, https://doi.org/10.5194/essd-9-927-2017, 2017.
地域
Dursleyの地区別のビジネスの分布 Cam: 45.7%
Uley: 17.5%
North Nibley: 8.1%
Town Centre: 6.8%
Coaley: 6%
その他: 15.8%
市外局番
Dursleyのビジネスによって使用されている市外局番の割合 市外局番 1453: 75.9%
市外局番 77: 7.2%
市外局番 78: 5.1%
その他: 11.8%
Dursley、 イングランドの価格によるビジネスの分布
安価な: 53.5%
適度な: 32.6%
非常に高価な: 11.6%
高価な: 2.3%
人間開発指数(HDI)
平均余命、教育、および一人当たり収入の統計的複合指数。Sources: [Link] Kummu, M., Taka, M. & Guillaume, J. Gridded global datasets for Gross Domestic Product and Human Development Index over 1990–2015. Sci Data 5, 180004 (2018) doi:10.1038/sdata.2018.4
Dursley、 イングランドの二酸化炭素排出量
1人あたりの二酸化炭素(CO2)排出量(年間トン)| 場所 | CO2排出量 | 一人当たりのCO2排出量 | CO2排出強度 |
|---|---|---|---|
| Dursley、 イングランド | 65,691 s/t | 10.7 s/t | 14,198 米トン/km² |
| Gloucestershire | 10,912,106 s/t | 12.5 s/t | 3,364 米トン/km² |
| イギリス | 735,672,543 s/t | 11.4 s/t | 2,967 米トン/km² |
Dursley、 イングランドの二酸化炭素排出量
| 2013年の二酸化炭素排出量 (トン/年) | 65,691 s/t |
| 2013の人口1人あたりの二酸化炭素排出量 (トン/年) | 10.7 s/t |
| 2013年の二酸化炭素排出量強度 (トン/km²/年) | 14,198 米トン/km² |
自然災害リスク
10のうちの相対リスク| 洪水 | 高 (8) |
| 地震 | 低 (2) |
*特に洪水または地滑りに関するリスクは、地域全体に及ぶとは限りません。
Sources: 1. Dilley, M., R.S. Chen, U. Deichmann, A.L. Lerner-Lam, M. Arnold, J. Agwe, P. Buys, O. Kjekstad, B. Lyon, and G. Yetman. 2005. Natural Disaster Hotspots: A Global Risk Analysis. Washington, D.C.: World Bank. https://doi.org/10.1596/0-8213-5930-4.
2. Center for Hazards and Risk Research - CHRR - Columbia University, Center for International Earth Science Information Network - CIESIN - Columbia University. 2005. Global Earthquake Hazard Distribution - Peak Ground Acceleration. Palisades, NY: NASA Socioeconomic Data and Applications Center (SEDAC). https://doi.org/10.7927/H4BZ63ZS.
3. Center for Hazards and Risk Research - CHRR - Columbia University, Center for International Earth Science Information Network - CIESIN - Columbia University. 2005. Global Flood Hazard Frequency and Distribution. Palisades, NY: NASA Socioeconomic Data and Applications Center (SEDAC). https://doi.org/10.7927/H4668B3D.
最近の近くの地震
マグニチュード3.0以上| 日付 | 時間 | 大きさ | 距離 | 深さ | 場所 | リンク |
|---|---|---|---|---|---|---|
| 2008/10/26 | 11:06 | 3.9 | 60 km | 9,300 m | England, United Kingdom | usgs.gov |
| 2004/01/29 | 12:23 | 3.7 | 79 km | 6,500 m | England, United Kingdom | usgs.gov |
| 2004/01/29 | 2:56 | 3.6 | 79 km | 6,500 m | England, United Kingdom | usgs.gov |
| 2004/01/29 | 2:56 | 3.3 | 79 km | 6,500 m | England, United Kingdom | usgs.gov |
| 2002/09/22 | 20:32 | 3.2 | 94.7 km | 9,300 m | England, United Kingdom | usgs.gov |
| 2002/09/22 | 16:53 | 4.8 | 94.3 km | 9,400 m | England, United Kingdom | usgs.gov |
| 2002/06/20 | 10:26 | 3.4 | 52 km | 14,300 m | Wales-England region, United Kingdom | usgs.gov |
| 2002/02/12 | 11:13 | 3.5 | 62.4 km | 8,300 m | Wales-England region, United Kingdom | usgs.gov |
| 2001/10/09 | 19:52 | 3.5 | 60.7 km | 10,000 m | Wales-England region, United Kingdom | usgs.gov |
| 2000/09/22 | 21:23 | 4 | 83.9 km | 13,100 m | England, United Kingdom | usgs.gov |
Dursley、 イングランド付近で発生した過去の地震の検索
最も早い日付 最新の日付
マグニチュード3.0以上 マグニチュード4.0以上 マグニチュード5.0以上
データについて
このページのデータは、公開されている多くのツールとリソースを使用して推定されています。保証なしで提供され、不正確な内容が含まれている可能性があります。自己責任。詳細については、 こちらをご覧ください。