- 世界
- »
- ID
- »
- 中部ジャワ州
- »
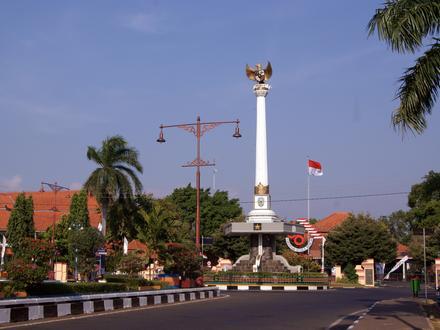
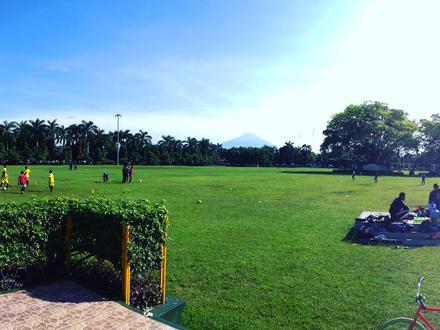
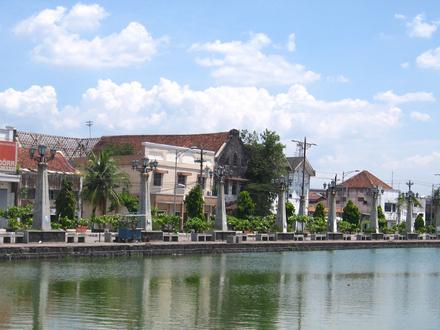
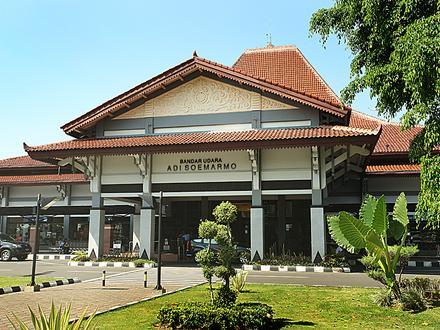
- Kudus、 中部ジャワ州
Kudusのビジネス
産業
産業別事業分布 ショッピング: 30.7%
レストラン: 15.8%
食品: 7.4%
教育: 6.2%
産業: 5.9%
ホテルと旅行: 5%
その他: 29%
| 業界の説明 | 事業所数 | Googleの平均評価 | 住民1,000人あたりのビジネス |
|---|---|---|---|
| 車の修理 | 193 | 4.2 | 0.3 |
| 美容院 | 112 | 4.2 | 0.2 |
| 行政 | 100 | 4.0 | 0.1 |
| 中等教育 | 111 | 4.4 | 0.2 |
| 小学校 | 208 | 4.2 | 0.3 |
| 教育その他 | 103 | 4.3 | 0.1 |
| 高等教育 (大学) | 92 | 4.2 | 0.1 |
| ローン会社 | 269 | 4.1 | 0.4 |
| 銀行 | 234 | 4.2 | 0.3 |
| コンビニエンスストア | 115 | 4.3 | 0.2 |
| ベーカリー | 86 | 4.2 | 0.1 |
| 食料雑貨品店・スーパーマーケット | 194 | 4.2 | 0.3 |
| 不動産 | 92 | 4.1 | 0.1 |
| その他の宿泊施設 | 95 | 3.9 | 0.1 |
| その他の会員組織 | 98 | 4.1 | 0.1 |
| 建物の建設 | 116 | 4.1 | 0.2 |
| 保健医療 | 131 | 3.9 | 0.2 |
| 病院 | 157 | 4.2 | 0.2 |
| モスク | 326 | 4.5 | 0.4 |
| アメリカ料理レストラン | 139 | 4.2 | 0.2 |
| インドネシア料理レストラン | 328 | 4.2 | 0.4 |
| カフェ | 249 | 4.1 | 0.3 |
| 事務用品・文房具店 | 172 | 4.3 | 0.2 |
| 服屋 | 181 | 4.2 | 0.2 |
| 百貨店 | 99 | 4.0 | 0.1 |
| 薬局・ドラッグストア | 108 | 4.0 | 0.1 |
| 金物店/ホームセンター | 145 | 4.1 | 0.2 |
| 電気店 | 190 | 4.1 | 0.3 |
| Kudus、 中部ジャワ州の面積 | 425.2 km² |
| 人口 | 738237 |
| 男性人口 | 364364 (49.4%) |
| 女性人口 | 373872 (50.6%) |
| 1975から2015にかけての人口の変動 | +45% |
| 2000から2015にかけての人口の変動 | +4.4% |
| 平均年齢 | 28.9 |
| 男性平均年齢 | 28.2 |
| 女性の平均年齢 | 29.5 |
| 市外局番 | 291 |
| 現地時間 | 日曜日 13:42 |
| 時間帯 | インドネシア西部時間 |
| 緯度と経度 | -6.8048° / 110.8405° |
| 郵便番号 | 59151, 59311, 59312, 59313, 59314, 多くの |
Kudus、 中部ジャワ州 - 地図
Kudus、 中部ジャワ州の人口
1975年から2015年まで| データ | 1975 | 1990 | 2000 | 2015 |
|---|---|---|---|---|
| 人口 | 509190 | 703201 | 707404 | 738237 |
| 人口密度 | 1197 / km² | 1653 / km² | 1663 / km² | 1736 / km² |
2000から2015にかけてのKudusの人口変動
2000年から2015年にかけての4.4%の増加| 場所 | 1975以来の変化 | 1990以来の変化 | 2000以来の変化 |
|---|---|---|---|
| Kudus、 中部ジャワ州 | +45% | +5% | +4.4% |
| 中部ジャワ州 | +32.8% | +8% | +2% |
| インドネシア | +96.9% | +41.9% | +21.7% |
Kudus、 中部ジャワ州の年齢中央値
年齢中央値:28.9 年| 場所 | 平均年齢 | 年齢の中央値(女性) | 年齢の中央値(男性) |
|---|---|---|---|
| Kudus、 中部ジャワ州 | 28.9 年 | 29.5 年 | 28.2 年 |
| 中部ジャワ州 | 30.1 年 | 30.7 年 | 29.4 年 |
| インドネシア | 27.2 年 | 27.5 年 | 26.9 年 |
Kudus、 中部ジャワ州の人口ピラミッド
年齢と性別による人口| 年齢 | 男性 | 女性 | 合計 |
|---|---|---|---|
| 5歳未満 | 30855 | 28983 | 59838 |
| 5-9 | 32089 | 30614 | 62703 |
| 10-14 | 33010 | 31337 | 64347 |
| 15-19 | 33084 | 32840 | 65925 |
| 20-24 | 31464 | 32076 | 63541 |
| 25-29 | 33683 | 34416 | 68099 |
| 30-34 | 31201 | 32408 | 63609 |
| 35-39 | 27655 | 29825 | 57480 |
| 40-44 | 27486 | 29439 | 56925 |
| 45-49 | 24171 | 25746 | 49918 |
| 50-54 | 20997 | 20070 | 41067 |
| 55-59 | 14661 | 13497 | 28159 |
| 60-64 | 8481 | 10498 | 18980 |
| 65-69 | 7034 | 9286 | 16321 |
| 70-74 | 4697 | 6741 | 11438 |
| 75-79 | 2514 | 3821 | 6336 |
| 80-84 | 895 | 1528 | 2423 |
| 85プラス | 388 | 746 | 1134 |
Kudus、 中部ジャワ州の人口密度
人口密度:1736 / km²| 場所 | 人口 | エリア | 人口密度 |
|---|---|---|---|
| Kudus、 中部ジャワ州 | 738237 | 425.2 km² | 1736 / km² |
| 中部ジャワ州 | 32.8 ミリオン | 34,144.9 km² | 961.3 / km² |
| インドネシア | 252.8 ミリオン | 1,893,657.8 km² | 133.5 / km² |
Kudus、 中部ジャワ州の過去および将来の予測人口
1500から2100にかけての推定人口Sources:
1. JRC (European Commission's Joint Research Centre) work on the GHS built-up grid
2. CIESIN (Center for International Earth Science Information Network)
3. [リンク] Klein Goldewijk, K., Beusen, A., Doelman, J., and Stehfest, E.: Anthropogenic land use estimates for the Holocene – HYDE 3.2, Earth Syst. Sci. Data, 9, 927–953, https://doi.org/10.5194/essd-9-927-2017, 2017.
市外局番
Kudusのビジネスによって使用されている市外局番の割合 市外局番 8: 55.7%
市外局番 29: 41.8%
その他: 2.5%
Kudus、 中部ジャワ州の価格によるビジネスの分布
適度な: 74.2%
安価な: 22%
高価な: 3.8%
人間開発指数(HDI)
平均余命、教育、および一人当たり収入の統計的複合指数。Sources: [Link] Kummu, M., Taka, M. & Guillaume, J. Gridded global datasets for Gross Domestic Product and Human Development Index over 1990–2015. Sci Data 5, 180004 (2018) doi:10.1038/sdata.2018.4
Kudus、 中部ジャワ州の二酸化炭素排出量
1人あたりの二酸化炭素(CO2)排出量(年間トン)| 場所 | CO2排出量 | 一人当たりのCO2排出量 | CO2排出強度 |
|---|---|---|---|
| Kudus、 中部ジャワ州 | 1,708,769 s/t | 2.31 s/t | 4,019 米トン/km² |
| 中部ジャワ州 | 65,917,921 s/t | 2.01 s/t | 1,930 米トン/km² |
| インドネシア | 478,610,416 s/t | 1.89 s/t | 252.7 米トン/km² |
Kudus、 中部ジャワ州の二酸化炭素排出量
| 2013年の二酸化炭素排出量 (トン/年) | 1,708,769 s/t |
| 2013の人口1人あたりの二酸化炭素排出量 (トン/年) | 2.31 s/t |
| 2013年の二酸化炭素排出量強度 (トン/km²/年) | 4,019 米トン/km² |
自然災害リスク
10のうちの相対リスク| 地すべり | 高 (7) |
| 干ばつ | 中 (5) |
| 洪水 | 高 (9) |
| 地震 | 中 (5.4) |
*特に洪水または地滑りに関するリスクは、地域全体に及ぶとは限りません。
Sources: 1. Dilley, M., R.S. Chen, U. Deichmann, A.L. Lerner-Lam, M. Arnold, J. Agwe, P. Buys, O. Kjekstad, B. Lyon, and G. Yetman. 2005. Natural Disaster Hotspots: A Global Risk Analysis. Washington, D.C.: World Bank. https://doi.org/10.1596/0-8213-5930-4.
2. Center for Hazards and Risk Research - CHRR - Columbia University, Center for International Earth Science Information Network - CIESIN - Columbia University. 2005. Global Earthquake Hazard Distribution - Peak Ground Acceleration. Palisades, NY: NASA Socioeconomic Data and Applications Center (SEDAC). https://doi.org/10.7927/H4BZ63ZS.
3. Center for Hazards and Risk Research - CHRR - Columbia University, Center for International Earth Science Information Network - CIESIN - Columbia University, and Norwegian Geotechnical Institute - NGI. 2005. Global Landslide Hazard Distribution. Palisades, NY: NASA Socioeconomic Data and Applications Center (SEDAC). https://doi.org/10.7927/H4P848VZ.
4. Center for Hazards and Risk Research - CHRR - Columbia University, Center for International Earth Science Information Network - CIESIN - Columbia University, and International Research Institute for Climate and Society - IRI - Columbia University. 2005. Global Drought Hazard Frequency and Distribution. Palisades, NY: NASA Socioeconomic Data and Applications Center (SEDAC). https://doi.org/10.7927/H4VX0DFT.
5. Center for Hazards and Risk Research - CHRR - Columbia University, Center for International Earth Science Information Network - CIESIN - Columbia University. 2005. Global Flood Hazard Frequency and Distribution. Palisades, NY: NASA Socioeconomic Data and Applications Center (SEDAC). https://doi.org/10.7927/H4668B3D.
最近の近くの地震
マグニチュード3.0以上| 日付 | 時間 | 大きさ | 距離 | 深さ | 場所 | リンク |
|---|---|---|---|---|---|---|
| 2018/06/28 | 11:26 | 4.2 | 83.1 km | 242,870 m | 24km SSE of Weleri, Indonesia | usgs.gov |
| 2018/05/02 | 15:47 | 4 | 41.4 km | 10,000 m | 3km ENE of Belah Lor, Indonesia | usgs.gov |
| 2017/07/10 | 15:17 | 4 | 71.3 km | 213,790 m | 4km S of Jatiklampok, Indonesia | usgs.gov |
| 2016/11/03 | 22:08 | 4.7 | 83.9 km | 17,870 m | 11km WNW of Ngawi, Indonesia | usgs.gov |
| 2016/03/04 | 10:01 | 4.2 | 98 km | 551,530 m | 60km N of Batang, Indonesia | usgs.gov |
| 2015/10/22 | 11:10 | 4.4 | 42.1 km | 53,750 m | 4km N of Batang, Indonesia | usgs.gov |
| 2015/06/01 | 16:12 | 4.1 | 51.8 km | 235,190 m | 5km NNW of Semarang, Indonesia | usgs.gov |
| 2014/07/25 | 22:57 | 4.2 | 74 km | 247,590 m | 0km S of Semampir, Indonesia | usgs.gov |
| 2010/02/26 | 21:04 | 4.4 | 69 km | 246,700 m | Java, Indonesia | usgs.gov |
| 2008/03/01 | 20:53 | 3.9 | 92.4 km | 250,000 m | Java, Indonesia | usgs.gov |
Kudus、 中部ジャワ州付近で発生した過去の地震の検索
最も早い日付 最新の日付
マグニチュード3.0以上 マグニチュード4.0以上 マグニチュード5.0以上
郵便番号
Kudusの郵便番号別のビジネスの割合 郵便番号 59333: 9.5%
郵便番号 59353: 8.5%
郵便番号 59332: 8.3%
郵便番号 59381: 6.6%
郵便番号 59382: 5.7%
郵便番号 59313: 5.4%
郵便番号 59372: 5.4%
その他: 50.6%
データについて
このページのデータは、公開されている多くのツールとリソースを使用して推定されています。保証なしで提供され、不正確な内容が含まれている可能性があります。自己責任。詳細については、 こちらをご覧ください。