- 世界
- »
- IN
- »
- ウッタル・プラデーシュ州
- »
- Budaun、 ウッタル・プラデーシュ州
Budaunのビジネス
産業
産業別事業分布 ショッピング: 31.5%
食品: 11.6%
教育: 8.6%
宗教: 7.4%
産業: 5.2%
医療: 5.1%
その他: 30.5%
| Budaun、 ウッタル・プラデーシュ州の面積 | 84 km² |
| 人口 | 743201 |
| 男性人口 | 396108 (53.3%) |
| 女性人口 | 347093 (46.7%) |
| 1975から2015にかけての人口の変動 | +94.9% |
| 2000から2015にかけての人口の変動 | +15.3% |
| 平均年齢 | 19 |
| 男性平均年齢 | 18.9 |
| 女性の平均年齢 | 19.1 |
| 市外局番 | 5832 |
| 地域 | Katrabrahmpur, Sarafa Market, Sarafa Market, Katrabrahmpur, Shastri Nagar, Shyam Nagar Colony, Sotha Mohallah |
| 現地時間 | 日曜日 12:14 |
| 時間帯 | インド標準時 |
| 緯度と経度 | 28.03811° / 79.12668° |
| 郵便番号 | 202525, 243601, 243634, 243635, 243636, 多くの |
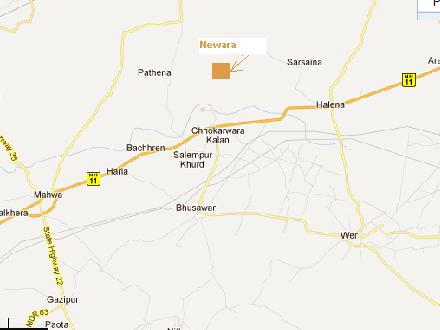
Budaun、 ウッタル・プラデーシュ州 - 地図
Budaun、 ウッタル・プラデーシュ州の人口
1975年から2015年まで| データ | 1975 | 1990 | 2000 | 2015 |
|---|---|---|---|---|
| 人口 | 381280 | 554859 | 644851 | 743201 |
| 人口密度 | 4539 / km² | 6605 / km² | 7676 / km² | 8847 / km² |
2000から2015にかけてのBudaunの人口変動
2000年から2015年にかけての15.3%の増加| 場所 | 1975以来の変化 | 1990以来の変化 | 2000以来の変化 |
|---|---|---|---|
| Budaun、 ウッタル・プラデーシュ州 | +94.9% | +33.9% | +15.3% |
| ウッタルプラデシ州 | +134.1% | +59.5% | +28.4% |
| インド | +111.1% | +50.6% | +24.5% |
Budaun、 ウッタル・プラデーシュ州の年齢中央値
年齢中央値:19 年| 場所 | 平均年齢 | 年齢の中央値(女性) | 年齢の中央値(男性) |
|---|---|---|---|
| Budaun、 ウッタル・プラデーシュ州 | 19 年 | 19.1 年 | 18.9 年 |
| ウッタルプラデシ州 | 21.3 年 | 21.7 年 | 21 年 |
| インド | 24.9 年 | 25.4 年 | 24.5 年 |
Budaun、 ウッタル・プラデーシュ州の人口ピラミッド
年齢と性別による人口| 年齢 | 男性 | 女性 | 合計 |
|---|---|---|---|
| 5歳未満 | 48241 | 44220 | 92462 |
| 5-9 | 56462 | 49326 | 105789 |
| 10-14 | 57212 | 48432 | 105644 |
| 15-19 | 46831 | 38309 | 85141 |
| 20-24 | 34303 | 28008 | 62312 |
| 25-29 | 26706 | 23638 | 50344 |
| 30-34 | 23379 | 21943 | 45322 |
| 35-39 | 23368 | 21075 | 44443 |
| 40-44 | 19972 | 16163 | 36136 |
| 45-49 | 14868 | 13370 | 28239 |
| 50-54 | 12426 | 9756 | 22183 |
| 55-59 | 8417 | 9479 | 17897 |
| 60-64 | 10265 | 9267 | 19533 |
| 65-69 | 5576 | 5766 | 11343 |
| 70-74 | 4148 | 4019 | 8168 |
| 75-79 | 1472 | 1653 | 3126 |
| 80-84 | 1197 | 1321 | 2518 |
| 85プラス | 1263 | 1347 | 2610 |
Budaun、 ウッタル・プラデーシュ州の人口密度
人口密度:8847 / km²| 場所 | 人口 | エリア | 人口密度 |
|---|---|---|---|
| Budaun、 ウッタル・プラデーシュ州 | 743201 | 84 km² | 8847 / km² |
| ウッタルプラデシ州 | 217.8 ミリオン | 240,777.3 km² | 904.6 / km² |
| インド | 1.3 ビリオン | 3,083,563.4 km² | 423.8 / km² |
Budaun、 ウッタル・プラデーシュ州の過去および将来の予測人口
300から2100にかけての推定人口Sources:
1. JRC (European Commission's Joint Research Centre) work on the GHS built-up grid
2. CIESIN (Center for International Earth Science Information Network)
3. [リンク] Klein Goldewijk, K., Beusen, A., Doelman, J., and Stehfest, E.: Anthropogenic land use estimates for the Holocene – HYDE 3.2, Earth Syst. Sci. Data, 9, 927–953, https://doi.org/10.5194/essd-9-927-2017, 2017.
地域
Budaunの地区別のビジネスの分布 Katrabrahmpur: 23.7%
Sotha Mohallah: 12.1%
Shastri Nagar: 9.3%
Sarafa Market: 8.8%
Sarafa Market, Katrabrahmpur: 5.6%
その他: 40.5%
市外局番
Budaunのビジネスによって使用されている市外局番の割合 市外局番 5832: 28.8%
市外局番 80: 11.5%
市外局番 180: 8.7%
市外局番 11: 7.7%
その他: 43.3%
人間開発指数(HDI)
平均余命、教育、および一人当たり収入の統計的複合指数。Sources: [Link] Kummu, M., Taka, M. & Guillaume, J. Gridded global datasets for Gross Domestic Product and Human Development Index over 1990–2015. Sci Data 5, 180004 (2018) doi:10.1038/sdata.2018.4
Budaun、 ウッタル・プラデーシュ州の二酸化炭素排出量
1人あたりの二酸化炭素(CO2)排出量(年間トン)| 場所 | CO2排出量 | 一人当たりのCO2排出量 | CO2排出強度 |
|---|---|---|---|
| Budaun、 ウッタル・プラデーシュ州 | 851,454 s/t | 1.15 s/t | 10,136 米トン/km² |
| ウッタルプラデシ州 | 259,048,938 s/t | 1.19 s/t | 1,075 米トン/km² |
| インド | 1,928,568,344 s/t | 1.48 s/t | 625.4 米トン/km² |
Budaun、 ウッタル・プラデーシュ州の二酸化炭素排出量
| 2013年の二酸化炭素排出量 (トン/年) | 851,454 s/t |
| 2013の人口1人あたりの二酸化炭素排出量 (トン/年) | 1.15 s/t |
| 2013年の二酸化炭素排出量強度 (トン/km²/年) | 10,136 米トン/km² |
自然災害リスク
10のうちの相対リスク| 干ばつ | 高 (8) |
| 洪水 | 高 (9) |
| 地震 | 中 (4) |
*特に洪水または地滑りに関するリスクは、地域全体に及ぶとは限りません。
Sources: 1. Dilley, M., R.S. Chen, U. Deichmann, A.L. Lerner-Lam, M. Arnold, J. Agwe, P. Buys, O. Kjekstad, B. Lyon, and G. Yetman. 2005. Natural Disaster Hotspots: A Global Risk Analysis. Washington, D.C.: World Bank. https://doi.org/10.1596/0-8213-5930-4.
2. Center for Hazards and Risk Research - CHRR - Columbia University, Center for International Earth Science Information Network - CIESIN - Columbia University. 2005. Global Earthquake Hazard Distribution - Peak Ground Acceleration. Palisades, NY: NASA Socioeconomic Data and Applications Center (SEDAC). https://doi.org/10.7927/H4BZ63ZS.
3. Center for Hazards and Risk Research - CHRR - Columbia University, Center for International Earth Science Information Network - CIESIN - Columbia University, and International Research Institute for Climate and Society - IRI - Columbia University. 2005. Global Drought Hazard Frequency and Distribution. Palisades, NY: NASA Socioeconomic Data and Applications Center (SEDAC). https://doi.org/10.7927/H4VX0DFT.
4. Center for Hazards and Risk Research - CHRR - Columbia University, Center for International Earth Science Information Network - CIESIN - Columbia University. 2005. Global Flood Hazard Frequency and Distribution. Palisades, NY: NASA Socioeconomic Data and Applications Center (SEDAC). https://doi.org/10.7927/H4668B3D.
最近の近くの地震
マグニチュード3.0以上
データについて
このページのデータは、公開されている多くのツールとリソースを使用して推定されています。保証なしで提供され、不正確な内容が含まれている可能性があります。自己責任。詳細については、 こちらをご覧ください。