- 世界
- »
- PH
- »
- カラバルソン地方
- »
- Pangil、 カラバルソン地方
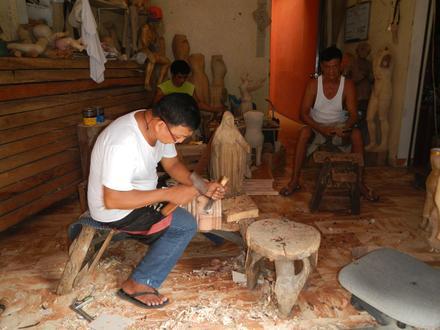
Pangilのビジネス
産業
産業別事業分布 レストラン: 17.3%
ショッピング: 12.8%
ホテルと旅行: 11.6%
教育: 9%
産業: 7.3%
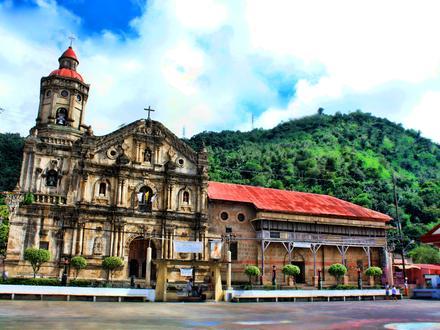
宗教: 7.3%
食品: 6.3%
その他: 28.4%
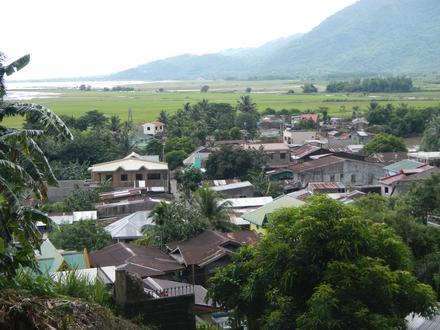
| Pangil、 カラバルソン地方の面積 | 45 km² |
| 人口 | 26876 |
| 男性人口 | 13700 (51%) |
| 女性人口 | 13176 (49%) |
| 1975から2015にかけての人口の変動 | +158.3% |
| 2000から2015にかけての人口の変動 | +5.6% |
| 平均年齢 | 23.5 |
| 男性平均年齢 | 23 |
| 女性の平均年齢 | 24.1 |
| 地域 | Sulib |
| 現地時間 | 日曜日 14:44 |
| 時間帯 | フィリピン標準時 |
| 緯度と経度 | 14.4033° / 121.46506° |
| 郵便番号 | 4018 |
Pangil、 カラバルソン地方 - 地図
Pangil、 カラバルソン地方の人口
1975年から2015年まで| データ | 1975 | 1990 | 2000 | 2015 |
|---|---|---|---|---|
| 人口 | 10405 | 20766 | 25456 | 26876 |
| 人口密度 | 231.1 / km² | 461.2 / km² | 565.3 / km² | 596.8 / km² |
2000から2015にかけてのPangilの人口変動
2000年から2015年にかけての5.6%の増加| 場所 | 1975以来の変化 | 1990以来の変化 | 2000以来の変化 |
|---|---|---|---|
| Pangil、 カラバルソン地方 | +158.3% | +29.4% | +5.6% |
| ラグナ州 | +521.6% | +129.2% | +52.1% |
| フィリピン | +146.5% | +63.3% | +29.5% |
Pangil、 カラバルソン地方の年齢中央値
年齢中央値:23.5 年| 場所 | 平均年齢 | 年齢の中央値(女性) | 年齢の中央値(男性) |
|---|---|---|---|
| Pangil、 カラバルソン地方 | 23.5 年 | 24.1 年 | 23 年 |
| ラグナ州 | 24.8 年 | 25.3 年 | 24.2 年 |
| フィリピン | 23.2 年 | 23.6 年 | 22.8 年 |
Pangil、 カラバルソン地方の人口ピラミッド
年齢と性別による人口| 年齢 | 男性 | 女性 | 合計 |
|---|---|---|---|
| 5歳未満 | 1528 | 1389 | 2918 |
| 5-9 | 1555 | 1406 | 2962 |
| 10-14 | 1578 | 1430 | 3008 |
| 15-19 | 1430 | 1329 | 2759 |
| 20-24 | 1256 | 1253 | 2510 |
| 25-29 | 1108 | 997 | 2106 |
| 30-34 | 979 | 984 | 1964 |
| 35-39 | 788 | 814 | 1603 |
| 40-44 | 855 | 833 | 1688 |
| 45-49 | 700 | 694 | 1394 |
| 50-54 | 651 | 612 | 1263 |
| 55-59 | 452 | 507 | 959 |
| 60-64 | 339 | 330 | 670 |
| 65-69 | 230 | 257 | 488 |
| 70-74 | 159 | 199 | 359 |
| 75-79 | 91 | 142 | 234 |
| 80-84 | 0 | 0 | 0 |
| 85プラス | 0 | 0 | 0 |
Pangil、 カラバルソン地方の人口密度
人口密度:596.8 / km²| 場所 | 人口 | エリア | 人口密度 |
|---|---|---|---|
| Pangil、 カラバルソン地方 | 26876 | 45 km² | 596.8 / km² |
| ラグナ州 | 3.2 ミリオン | 2,664.8 km² | 1191 / km² |
| フィリピン | 96.6 ミリオン | 296,939.4 km² | 325.3 / km² |
Pangil、 カラバルソン地方の過去および将来の予測人口
1700から2100にかけての推定人口Sources:
1. JRC (European Commission's Joint Research Centre) work on the GHS built-up grid
2. CIESIN (Center for International Earth Science Information Network)
3. [リンク] Klein Goldewijk, K., Beusen, A., Doelman, J., and Stehfest, E.: Anthropogenic land use estimates for the Holocene – HYDE 3.2, Earth Syst. Sci. Data, 9, 927–953, https://doi.org/10.5194/essd-9-927-2017, 2017.
地域
Pangilの地区別のビジネスの分布 Sulib: 36.4%
Natividad: 18.2%
Barangay Natividad (Pob.): 18.2%
Isla: 9.1%
Dambo: 9.1%
Isla (Pob.): 9.1%
市外局番
Pangilのビジネスによって使用されている市外局番の割合 市外局番 49: 52.6%
市外局番 916: 10.5%
市外局番 919: 10.5%
市外局番 93: 10.5%
市外局番 2: 5.3%
市外局番 917: 5.3%
市外局番 921: 5.3%
人間開発指数(HDI)
平均余命、教育、および一人当たり収入の統計的複合指数。Sources: [Link] Kummu, M., Taka, M. & Guillaume, J. Gridded global datasets for Gross Domestic Product and Human Development Index over 1990–2015. Sci Data 5, 180004 (2018) doi:10.1038/sdata.2018.4
Pangil、 カラバルソン地方の二酸化炭素排出量
1人あたりの二酸化炭素(CO2)排出量(年間トン)| 場所 | CO2排出量 | 一人当たりのCO2排出量 | CO2排出強度 |
|---|---|---|---|
| Pangil、 カラバルソン地方 | 41,635 s/t | 1.55 s/t | 924.6 米トン/km² |
| ラグナ州 | 4,994,521 s/t | 1.57 s/t | 1,874 米トン/km² |
| フィリピン | 104,920,564 s/t | 1.09 s/t | 353.3 米トン/km² |
Pangil、 カラバルソン地方の二酸化炭素排出量
| 2013年の二酸化炭素排出量 (トン/年) | 41,635 s/t |
| 2013の人口1人あたりの二酸化炭素排出量 (トン/年) | 1.55 s/t |
| 2013年の二酸化炭素排出量強度 (トン/km²/年) | 924.6 米トン/km² |
自然災害リスク
10のうちの相対リスク| 地すべり | 高 (8) |
| サイクロン | 高 (10) |
| 干ばつ | 中 (4) |
| 洪水 | 高 (10) |
| 地震 | 高 (8) |
*特に洪水または地滑りに関するリスクは、地域全体に及ぶとは限りません。
Sources: 1. Dilley, M., R.S. Chen, U. Deichmann, A.L. Lerner-Lam, M. Arnold, J. Agwe, P. Buys, O. Kjekstad, B. Lyon, and G. Yetman. 2005. Natural Disaster Hotspots: A Global Risk Analysis. Washington, D.C.: World Bank. https://doi.org/10.1596/0-8213-5930-4.
2. Center for Hazards and Risk Research - CHRR - Columbia University, Center for International Earth Science Information Network - CIESIN - Columbia University. 2005. Global Flood Hazard Frequency and Distribution. Palisades, NY: NASA Socioeconomic Data and Applications Center (SEDAC). https://doi.org/10.7927/H4668B3D.
3. Center for Hazards and Risk Research - CHRR - Columbia University, Center for International Earth Science Information Network - CIESIN - Columbia University, and Norwegian Geotechnical Institute - NGI. 2005. Global Landslide Hazard Distribution. Palisades, NY: NASA Socioeconomic Data and Applications Center (SEDAC). https://doi.org/10.7927/H4P848VZ.
4. Center for Hazards and Risk Research - CHRR - Columbia University, Center for International Earth Science Information Network - CIESIN - Columbia University, and International Research Institute for Climate and Society - IRI - Columbia University. 2005. Global Drought Hazard Frequency and Distribution. Palisades, NY: NASA Socioeconomic Data and Applications Center (SEDAC). https://doi.org/10.7927/H4VX0DFT.
5. Center for Hazards and Risk Research - CHRR - Columbia University, Center for International Earth Science Information Network - CIESIN - Columbia University, International Bank for Reconstruction and Development - The World Bank, and United Nations Environment Programme Global Resource Information Database Geneva - UNEP/GRID-Geneva. 2005. Global Cyclone Hazard Frequency and Distribution. Palisades, NY: NASA Socioeconomic Data and Applications Center (SEDAC). https://doi.org/10.7927/H4CZ353K.
6. Center for Hazards and Risk Research - CHRR - Columbia University, Center for International Earth Science Information Network - CIESIN - Columbia University. 2005. Global Earthquake Hazard Distribution - Peak Ground Acceleration. Palisades, NY: NASA Socioeconomic Data and Applications Center (SEDAC). https://doi.org/10.7927/H4BZ63ZS.
最近の近くの地震
マグニチュード3.0以上| 日付 | 時間 | 大きさ | 距離 | 深さ | 場所 | リンク |
|---|---|---|---|---|---|---|
| 2019/07/03 | 20:00 | 4.5 | 57.7 km | 10,000 m | 0km SSE of Montecillo, Philippines | usgs.gov |
| 2018/10/14 | 18:56 | 4.5 | 63.9 km | 41,880 m | 6km S of Panukulan, Philippines | usgs.gov |
| 2018/07/05 | 14:00 | 4.4 | 55.1 km | 35,000 m | 21km NNE of Perez, Philippines | usgs.gov |
| 2017/06/20 | 18:18 | 4.3 | 47 km | 10,000 m | 0km E of San Andres, Philippines | usgs.gov |
| 2016/11/09 | 23:11 | 4.8 | 42.7 km | 59,240 m | 20km N of Daraitan, Philippines | usgs.gov |
| 2016/02/02 | 5:04 | 4.2 | 63.8 km | 119,790 m | 1km ESE of Banaybanay, Philippines | usgs.gov |
| 2015/12/20 | 20:46 | 4.4 | 33.3 km | 35,000 m | 2km ENE of Lucban, Philippines | usgs.gov |
| 2015/08/24 | 11:06 | 4.5 | 47.7 km | 35,000 m | 1km S of Binan, Philippines | usgs.gov |
| 2014/09/12 | 11:44 | 4.4 | 67.6 km | 143,630 m | 1km NNW of Balagtasin, Philippines | usgs.gov |
| 2012/10/30 | 19:07 | 4.5 | 56.6 km | 35,000 m | Luzon, Philippines | usgs.gov |
Pangil、 カラバルソン地方付近で発生した過去の地震の検索
最も早い日付 最新の日付
マグニチュード3.0以上 マグニチュード4.0以上 マグニチュード5.0以上
データについて
このページのデータは、公開されている多くのツールとリソースを使用して推定されています。保証なしで提供され、不正確な内容が含まれている可能性があります。自己責任。詳細については、 こちらをご覧ください。