- 世界
- »
- PH
- »
- マニラ首都圏
- »
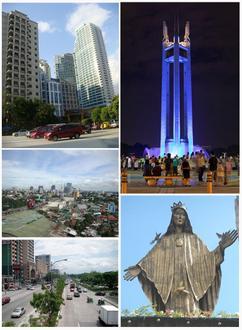
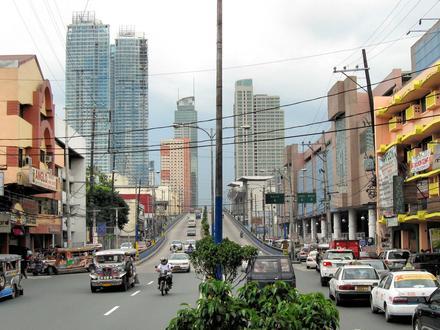
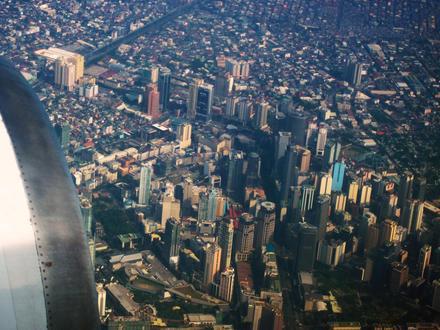
- Pasig City、 マニラ首都圏
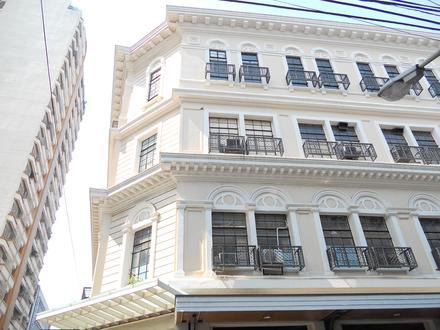
Pasig Cityのビジネス
産業
産業別事業分布 ショッピング: 22.1%
レストラン: 14%
専門家のサービス: 12.3%
食品: 7.8%
医療: 7%
産業: 6.6%
ホームサービス: 6.6%
その他: 23.7%
| 業界の説明 | 事業所数 | Googleの平均評価 | 住民1,000人あたりのビジネス |
|---|---|---|---|
| 車の修理 | 86 | 3.8 | 0.1 |
| 美容院 | 71 | 4.1 | 0.1 |
| 政府機関 | 86 | 4.3 | 0.1 |
| 行政 | 93 | 3.8 | 0.1 |
| 中等教育 | 76 | 4.6 | 0.1 |
| ローン会社 | 298 | 3.6 | 0.4 |
| 金融その他 | 172 | 3.4 | 0.2 |
| 銀行 | 115 | 3.6 | 0.2 |
| 食料雑貨品店・スーパーマーケット | 144 | 4.1 | 0.2 |
| ゼネコン | 131 | 4.5 | 0.2 |
| 不動産 | 198 | 4.1 | 0.3 |
| 旅行代理店 | 85 | 3.9 | 0.1 |
| トラクターや農機具 | 86 | 4.3 | 0.1 |
| 卸売業者 | 80 | 3.9 | 0.1 |
| 建物の建設 | 107 | 4.0 | 0.1 |
| 機械の卸売 | 289 | 4.1 | 0.4 |
| 貨物輸送 | 80 | 3.0 | 0.1 |
| 食品・飲料・タバコの卸売 | 93 | 4.0 | 0.1 |
| 一般開業医 | 361 | 3.4 | 0.5 |
| 保健医療 | 511 | 3.9 | 0.7 |
| 歯医者 | 78 | 4.4 | 0.1 |
| ビジネスサービス | 101 | 4.2 | 0.1 |
| 企業マネジメント | 262 | 4.3 | 0.3 |
| 広告とマーケティング | 79 | 3.7 | 0.1 |
| 弁護士 | 121 | 3.5 | 0.2 |
| 雇用機関 | 120 | 4.2 | 0.2 |
| 教会 | 63 | 4.7 | 0.1 |
| ファーストフードレストラン | 97 | 4.2 | 0.1 |
| 宝石や時計 | 65 | 3.6 | 0.1 |
| 家具店 | 70 | 3.4 | 0.1 |
| 家電製品・グッズ | 67 | 3.8 | 0.1 |
| 百貨店 | 107 | 4.1 | 0.1 |
| 薬局・ドラッグストア | 166 | 3.9 | 0.2 |
| 金物店/ホームセンター | 206 | 3.5 | 0.3 |
| 電気店 | 133 | 4.0 | 0.2 |
| Pasig City、 マニラ首都圏の面積 | 32 km² |
| 人口 | 763031 |
| 男性人口 | 372950 (48.9%) |
| 女性人口 | 390081 (51.1%) |
| 1975から2015にかけての人口の変動 | +496.5% |
| 2000から2015にかけての人口の変動 | +43.4% |
| 平均年齢 | 25.8 |
| 男性平均年齢 | 25.3 |
| 女性の平均年齢 | 26.3 |
| 地域 | Barangay 76, Kapitolyo, Manggahan, Ortigas Center, Pasay City District 1, Pasig City, Rosario, San Antonio, Ugong |
| 現地時間 | 日曜日 20:32 |
| 時間帯 | フィリピン標準時 |
| 緯度と経度 | 14.58691° / 121.0614° |
| 郵便番号 | 1650, 1651, 1652, 1653, 1654, 多くの |
Pasig City、 マニラ首都圏 - 地図
Pasig City、 マニラ首都圏の人口
1975年から2015年まで| データ | 1975 | 1990 | 2000 | 2015 |
|---|---|---|---|---|
| 人口 | 127922 | 354969 | 532146 | 763031 |
| 人口密度 | 3996 / km² | 11088 / km² | 16623 / km² | 23836 / km² |
2000から2015にかけてのPasig Cityの人口変動
2000年から2015年にかけての43.4%の増加| 場所 | 1975以来の変化 | 1990以来の変化 | 2000以来の変化 |
|---|---|---|---|
| Pasig City、 マニラ首都圏 | +496.5% | +115% | +43.4% |
| 首都圏 | +275% | +74.4% | +30.2% |
| フィリピン | +146.5% | +63.3% | +29.5% |
Pasig City、 マニラ首都圏の年齢中央値
年齢中央値:25.8 年| 場所 | 平均年齢 | 年齢の中央値(女性) | 年齢の中央値(男性) |
|---|---|---|---|
| Pasig City、 マニラ首都圏 | 25.8 年 | 26.3 年 | 25.3 年 |
| 首都圏 | 26.7 年 | 27.4 年 | 26 年 |
| フィリピン | 23.2 年 | 23.6 年 | 22.8 年 |
Pasig City、 マニラ首都圏の人口ピラミッド
年齢と性別による人口| 年齢 | 男性 | 女性 | 合計 |
|---|---|---|---|
| 5歳未満 | 38734 | 36023 | 74758 |
| 5-9 | 38467 | 35434 | 73902 |
| 10-14 | 37195 | 35276 | 72472 |
| 15-19 | 34453 | 37353 | 71806 |
| 20-24 | 35763 | 40431 | 76195 |
| 25-29 | 36542 | 39736 | 76278 |
| 30-34 | 34478 | 35994 | 70472 |
| 35-39 | 29228 | 29765 | 58993 |
| 40-44 | 24284 | 25491 | 49776 |
| 45-49 | 19318 | 20668 | 39986 |
| 50-54 | 15622 | 17557 | 33179 |
| 55-59 | 11320 | 13239 | 24559 |
| 60-64 | 8496 | 10077 | 18573 |
| 65-69 | 4360 | 5771 | 10131 |
| 70-74 | 2967 | 4427 | 7395 |
| 75-79 | 1724 | 2838 | 4562 |
| 80-84 | 0 | 0 | 0 |
| 85プラス | 0 | 0 | 0 |
Pasig City、 マニラ首都圏の人口密度
人口密度:23836 / km²| 場所 | 人口 | エリア | 人口密度 |
|---|---|---|---|
| Pasig City、 マニラ首都圏 | 763031 | 32 km² | 23836 / km² |
| 首都圏 | 284909 | 11.2 km² | 25529 / km² |
| フィリピン | 96.6 ミリオン | 296,939.4 km² | 325.3 / km² |
Pasig City、 マニラ首都圏の過去および将来の予測人口
1880から2100にかけての推定人口Sources:
1. JRC (European Commission's Joint Research Centre) work on the GHS built-up grid
2. CIESIN (Center for International Earth Science Information Network)
3. [リンク] Klein Goldewijk, K., Beusen, A., Doelman, J., and Stehfest, E.: Anthropogenic land use estimates for the Holocene – HYDE 3.2, Earth Syst. Sci. Data, 9, 927–953, https://doi.org/10.5194/essd-9-927-2017, 2017.
地域
Pasig Cityの地区別のビジネスの分布 San Antonio: 10.3%
Ugong: 7.2%
Kapitolyo: 7%
Barangay 76: 6.5%
その他: 69.1%
Pasig City、 マニラ首都圏の価格によるビジネスの分布
安価な: 41.8%
適度な: 41.8%
非常に高価な: 13%
高価な: 3.3%
人間開発指数(HDI)
平均余命、教育、および一人当たり収入の統計的複合指数。Sources: [Link] Kummu, M., Taka, M. & Guillaume, J. Gridded global datasets for Gross Domestic Product and Human Development Index over 1990–2015. Sci Data 5, 180004 (2018) doi:10.1038/sdata.2018.4
Pasig City、 マニラ首都圏の二酸化炭素排出量
1人あたりの二酸化炭素(CO2)排出量(年間トン)| 場所 | CO2排出量 | 一人当たりのCO2排出量 | CO2排出強度 |
|---|---|---|---|
| Pasig City、 マニラ首都圏 | 1,034,421 s/t | 1.36 s/t | 32,313 米トン/km² |
| 首都圏 | 340,054 s/t | 1.19 s/t | 30,470 米トン/km² |
| フィリピン | 104,920,564 s/t | 1.09 s/t | 353.3 米トン/km² |
Pasig City、 マニラ首都圏の二酸化炭素排出量
| 2013年の二酸化炭素排出量 (トン/年) | 1,034,421 s/t |
| 2013の人口1人あたりの二酸化炭素排出量 (トン/年) | 1.36 s/t |
| 2013年の二酸化炭素排出量強度 (トン/km²/年) | 32,313 米トン/km² |
自然災害リスク
10のうちの相対リスク| サイクロン | 高 (10) |
| 干ばつ | 中 (4) |
| 洪水 | 高 (10) |
| 地震 | 高 (8) |
*特に洪水または地滑りに関するリスクは、地域全体に及ぶとは限りません。
Sources: 1. Dilley, M., R.S. Chen, U. Deichmann, A.L. Lerner-Lam, M. Arnold, J. Agwe, P. Buys, O. Kjekstad, B. Lyon, and G. Yetman. 2005. Natural Disaster Hotspots: A Global Risk Analysis. Washington, D.C.: World Bank. https://doi.org/10.1596/0-8213-5930-4.
2. Center for Hazards and Risk Research - CHRR - Columbia University, Center for International Earth Science Information Network - CIESIN - Columbia University. 2005. Global Earthquake Hazard Distribution - Peak Ground Acceleration. Palisades, NY: NASA Socioeconomic Data and Applications Center (SEDAC). https://doi.org/10.7927/H4BZ63ZS.
3. Center for Hazards and Risk Research - CHRR - Columbia University, Center for International Earth Science Information Network - CIESIN - Columbia University, and International Research Institute for Climate and Society - IRI - Columbia University. 2005. Global Drought Hazard Frequency and Distribution. Palisades, NY: NASA Socioeconomic Data and Applications Center (SEDAC). https://doi.org/10.7927/H4VX0DFT.
4. Center for Hazards and Risk Research - CHRR - Columbia University, Center for International Earth Science Information Network - CIESIN - Columbia University, International Bank for Reconstruction and Development - The World Bank, and United Nations Environment Programme Global Resource Information Database Geneva - UNEP/GRID-Geneva. 2005. Global Cyclone Hazard Frequency and Distribution. Palisades, NY: NASA Socioeconomic Data and Applications Center (SEDAC). https://doi.org/10.7927/H4CZ353K.
5. Center for Hazards and Risk Research - CHRR - Columbia University, Center for International Earth Science Information Network - CIESIN - Columbia University. 2005. Global Flood Hazard Frequency and Distribution. Palisades, NY: NASA Socioeconomic Data and Applications Center (SEDAC). https://doi.org/10.7927/H4668B3D.
最近の近くの地震
マグニチュード3.0以上| 日付 | 時間 | 大きさ | 距離 | 深さ | 場所 | リンク |
|---|---|---|---|---|---|---|
| 2019/06/10 | 16:03 | 4.2 | 39.8 km | 185,490 m | 4km NNE of Naic, Philippines | usgs.gov |
| 2019/04/23 | 11:02 | 4.7 | 60.6 km | 50,080 m | 3km S of Lubao, Philippines | usgs.gov |
| 2019/03/11 | 13:11 | 4.2 | 61.1 km | 160,580 m | 3km SSW of Luksuhin, Philippines | usgs.gov |
| 2017/06/20 | 18:18 | 4.3 | 62 km | 10,000 m | 0km E of San Andres, Philippines | usgs.gov |
| 2016/11/09 | 23:11 | 4.8 | 44.8 km | 59,240 m | 20km N of Daraitan, Philippines | usgs.gov |
| 2015/12/14 | 16:12 | 4.1 | 62.6 km | 10,720 m | 1km SSW of San Juan, Philippines | usgs.gov |
| 2015/08/24 | 11:06 | 4.5 | 37.2 km | 35,000 m | 1km S of Binan, Philippines | usgs.gov |
| 2014/06/26 | 11:00 | 4.1 | 62.6 km | 10,000 m | 4km ENE of Parang, Philippines | usgs.gov |
| 2013/03/11 | 23:31 | 4.5 | 62.7 km | 110,100 m | 11km WNW of Looc, Philippines | usgs.gov |
| 2012/10/12 | 11:53 | 4.8 | 51.1 km | 110,400 m | Luzon, Philippines | usgs.gov |
Pasig City、 マニラ首都圏付近で発生した過去の地震の検索
最も早い日付 最新の日付
マグニチュード3.0以上 マグニチュード4.0以上 マグニチュード5.0以上
郵便番号
Pasig Cityの郵便番号別のビジネスの割合 郵便番号 1600: 32.1%
郵便番号 1300: 30.1%
郵便番号 1605: 15%
その他: 22.8%
データについて
このページのデータは、公開されている多くのツールとリソースを使用して推定されています。保証なしで提供され、不正確な内容が含まれている可能性があります。自己責任。詳細については、 こちらをご覧ください。