- 世界
- »
- PH
- »
- 東ビサヤ地方
- »
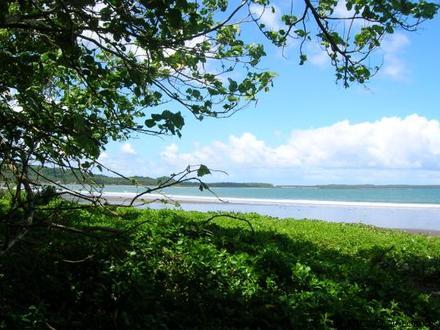
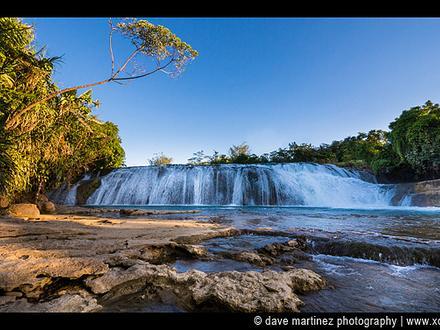
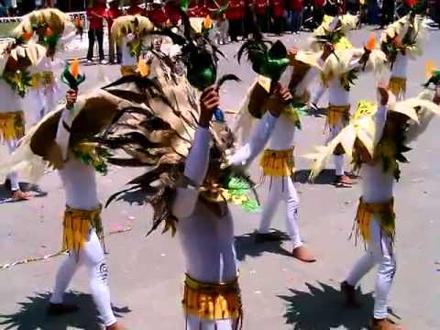
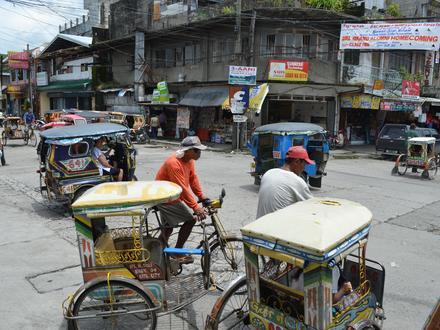
- San Julian、 東ビサヤ地方
San Julianのビジネス
産業
産業別事業分布 教育: 18.9%
食品: 13.2%
ショッピング: 10.7%
レストラン: 10.7%
ホテルと旅行: 8.8%
宗教: 6.9%
自治体: 6.9%
スポーツとアクティビティ: 5.7%
その他: 18.2%
| San Julian、 東ビサヤ地方の面積 | 150.6 km² |
| 人口 | 14518 |
| 男性人口 | 7520 (51.8%) |
| 女性人口 | 6998 (48.2%) |
| 1975から2015にかけての人口の変動 | +123.8% |
| 2000から2015にかけての人口の変動 | +24.3% |
| 平均年齢 | 22 |
| 男性平均年齢 | 21.8 |
| 女性の平均年齢 | 22.3 |
| 市外局番 | 55 |
| 現地時間 | 月曜日 12:16 |
| 時間帯 | フィリピン標準時 |
| 緯度と経度 | 11.75361° / 125.45583° |
| 郵便番号 | 6814 |
San Julian、 東ビサヤ地方 - 地図
San Julian、 東ビサヤ地方の人口
1975年から2015年まで| データ | 1975 | 1990 | 2000 | 2015 |
|---|---|---|---|---|
| 人口 | 6488 | 9267 | 11684 | 14518 |
| 人口密度 | 43.1 / km² | 61.5 / km² | 77.6 / km² | 96.4 / km² |
2000から2015にかけてのSan Julianの人口変動
2000年から2015年にかけての24.3%の増加| 場所 | 1975以来の変化 | 1990以来の変化 | 2000以来の変化 |
|---|---|---|---|
| San Julian、 東ビサヤ地方 | +123.8% | +56.7% | +24.3% |
| 東サマル州 | +190.2% | +81.3% | +38.2% |
| フィリピン | +146.5% | +63.3% | +29.5% |
San Julian、 東ビサヤ地方の年齢中央値
年齢中央値:22 年| 場所 | 平均年齢 | 年齢の中央値(女性) | 年齢の中央値(男性) |
|---|---|---|---|
| San Julian、 東ビサヤ地方 | 22 年 | 22.3 年 | 21.8 年 |
| 東サマル州 | 20.8 年 | 21.1 年 | 20.6 年 |
| フィリピン | 23.2 年 | 23.6 年 | 22.8 年 |
San Julian、 東ビサヤ地方の人口ピラミッド
年齢と性別による人口| 年齢 | 男性 | 女性 | 合計 |
|---|---|---|---|
| 5歳未満 | 828 | 823 | 1651 |
| 5-9 | 886 | 838 | 1724 |
| 10-14 | 966 | 948 | 1915 |
| 15-19 | 882 | 694 | 1576 |
| 20-24 | 558 | 426 | 984 |
| 25-29 | 482 | 418 | 901 |
| 30-34 | 451 | 401 | 852 |
| 35-39 | 444 | 418 | 862 |
| 40-44 | 439 | 408 | 848 |
| 45-49 | 355 | 337 | 693 |
| 50-54 | 312 | 277 | 590 |
| 55-59 | 245 | 244 | 490 |
| 60-64 | 214 | 241 | 456 |
| 65-69 | 215 | 220 | 436 |
| 70-74 | 146 | 180 | 326 |
| 75-79 | 97 | 124 | 222 |
| 80-84 | 0 | 0 | 0 |
| 85プラス | 0 | 0 | 0 |
San Julian、 東ビサヤ地方の人口密度
人口密度:96.4 / km²| 場所 | 人口 | エリア | 人口密度 |
|---|---|---|---|
| San Julian、 東ビサヤ地方 | 14518 | 150.6 km² | 96.4 / km² |
| 東サマル州 | 427158 | 4,185.6 km² | 102.1 / km² |
| フィリピン | 96.6 ミリオン | 296,939.4 km² | 325.3 / km² |
San Julian、 東ビサヤ地方の過去および将来の予測人口
1700から2100にかけての推定人口Sources:
1. JRC (European Commission's Joint Research Centre) work on the GHS built-up grid
2. CIESIN (Center for International Earth Science Information Network)
3. [リンク] Klein Goldewijk, K., Beusen, A., Doelman, J., and Stehfest, E.: Anthropogenic land use estimates for the Holocene – HYDE 3.2, Earth Syst. Sci. Data, 9, 927–953, https://doi.org/10.5194/essd-9-927-2017, 2017.
市外局番
San Julianのビジネスによって使用されている市外局番の割合 市外局番 917: 22.2%
市外局番 56: 11.1%
市外局番 905: 11.1%
市外局番 906: 11.1%
市外局番 909: 11.1%
市外局番 918: 11.1%
市外局番 920: 11.1%
市外局番 929: 11.1%
人間開発指数(HDI)
平均余命、教育、および一人当たり収入の統計的複合指数。Sources: [Link] Kummu, M., Taka, M. & Guillaume, J. Gridded global datasets for Gross Domestic Product and Human Development Index over 1990–2015. Sci Data 5, 180004 (2018) doi:10.1038/sdata.2018.4
San Julian、 東ビサヤ地方の二酸化炭素排出量
1人あたりの二酸化炭素(CO2)排出量(年間トン)| 場所 | CO2排出量 | 一人当たりのCO2排出量 | CO2排出強度 |
|---|---|---|---|
| San Julian、 東ビサヤ地方 | 14,375 s/t | 0.99 s/t | 95.4 米トン/km² |
| 東サマル州 | 432,166 s/t | 1.01 s/t | 103.3 米トン/km² |
| フィリピン | 104,920,564 s/t | 1.09 s/t | 353.3 米トン/km² |
San Julian、 東ビサヤ地方の二酸化炭素排出量
| 2013年の二酸化炭素排出量 (トン/年) | 14,375 s/t |
| 2013の人口1人あたりの二酸化炭素排出量 (トン/年) | 0.99 s/t |
| 2013年の二酸化炭素排出量強度 (トン/km²/年) | 95.4 米トン/km² |
自然災害リスク
10のうちの相対リスク| 地すべり | 高 (7) |
| サイクロン | 高 (10) |
| 干ばつ | 中 (4) |
| 洪水 | 高 (7) |
| 地震 | 高 (8) |
*特に洪水または地滑りに関するリスクは、地域全体に及ぶとは限りません。
Sources: 1. Dilley, M., R.S. Chen, U. Deichmann, A.L. Lerner-Lam, M. Arnold, J. Agwe, P. Buys, O. Kjekstad, B. Lyon, and G. Yetman. 2005. Natural Disaster Hotspots: A Global Risk Analysis. Washington, D.C.: World Bank. https://doi.org/10.1596/0-8213-5930-4.
2. Center for Hazards and Risk Research - CHRR - Columbia University, Center for International Earth Science Information Network - CIESIN - Columbia University. 2005. Global Flood Hazard Frequency and Distribution. Palisades, NY: NASA Socioeconomic Data and Applications Center (SEDAC). https://doi.org/10.7927/H4668B3D.
3. Center for Hazards and Risk Research - CHRR - Columbia University, Center for International Earth Science Information Network - CIESIN - Columbia University, and Norwegian Geotechnical Institute - NGI. 2005. Global Landslide Hazard Distribution. Palisades, NY: NASA Socioeconomic Data and Applications Center (SEDAC). https://doi.org/10.7927/H4P848VZ.
4. Center for Hazards and Risk Research - CHRR - Columbia University, Center for International Earth Science Information Network - CIESIN - Columbia University, and International Research Institute for Climate and Society - IRI - Columbia University. 2005. Global Drought Hazard Frequency and Distribution. Palisades, NY: NASA Socioeconomic Data and Applications Center (SEDAC). https://doi.org/10.7927/H4VX0DFT.
5. Center for Hazards and Risk Research - CHRR - Columbia University, Center for International Earth Science Information Network - CIESIN - Columbia University, International Bank for Reconstruction and Development - The World Bank, and United Nations Environment Programme Global Resource Information Database Geneva - UNEP/GRID-Geneva. 2005. Global Cyclone Hazard Frequency and Distribution. Palisades, NY: NASA Socioeconomic Data and Applications Center (SEDAC). https://doi.org/10.7927/H4CZ353K.
6. Center for Hazards and Risk Research - CHRR - Columbia University, Center for International Earth Science Information Network - CIESIN - Columbia University. 2005. Global Earthquake Hazard Distribution - Peak Ground Acceleration. Palisades, NY: NASA Socioeconomic Data and Applications Center (SEDAC). https://doi.org/10.7927/H4BZ63ZS.
最近の近くの地震
マグニチュード3.0以上| 日付 | 時間 | 大きさ | 距離 | 深さ | 場所 | リンク |
|---|---|---|---|---|---|---|
| 2018/03/29 | 10:20 | 4.6 | 15.6 km | 38,060 m | 14km ENE of Maypangdan, Philippines | usgs.gov |
| 2013/02/18 | 1:06 | 4.4 | 7 km | 65,400 m | Samar, Philippines | usgs.gov |
| 2012/10/09 | 3:47 | 4.5 | 9.9 km | 55,000 m | Samar, Philippines | usgs.gov |
| 2012/07/25 | 1:39 | 4.7 | 5 km | 70,800 m | Samar, Philippines | usgs.gov |
| 2012/02/04 | 11:17 | 4.7 | 14.3 km | 10,000 m | Samar, Philippines | usgs.gov |
| 2012/01/31 | 12:30 | 4.7 | 9.1 km | 10,000 m | Samar, Philippines | usgs.gov |
| 2010/07/20 | 14:50 | 5 | 6.9 km | 45,900 m | Samar, Philippines | usgs.gov |
| 2008/01/31 | 16:16 | 4.1 | 13.8 km | 35,000 m | Samar, Philippines | usgs.gov |
| 2008/01/19 | 13:45 | 4 | 5.3 km | 35,000 m | Samar, Philippines | usgs.gov |
| 2006/12/08 | 14:35 | 4.3 | 15 km | 35,000 m | Samar, Philippines | usgs.gov |
San Julian、 東ビサヤ地方付近で発生した過去の地震の検索
最も早い日付 最新の日付
マグニチュード3.0以上 マグニチュード4.0以上 マグニチュード5.0以上
データについて
このページのデータは、公開されている多くのツールとリソースを使用して推定されています。保証なしで提供され、不正確な内容が含まれている可能性があります。自己責任。詳細については、 こちらをご覧ください。