- 世界
- »
- US
- »
- アイオワ州
- »
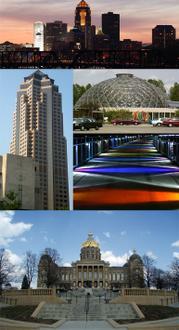
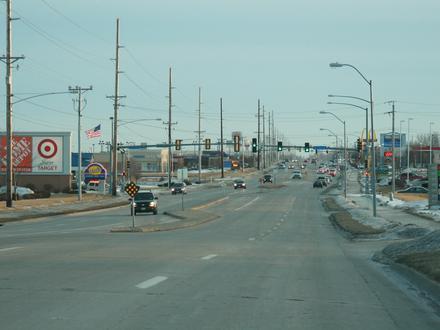
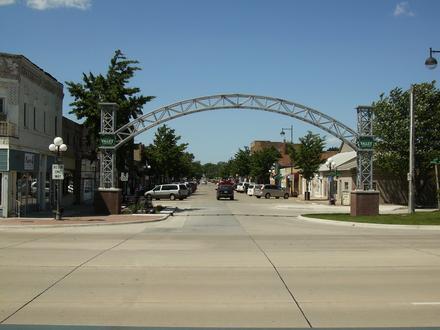
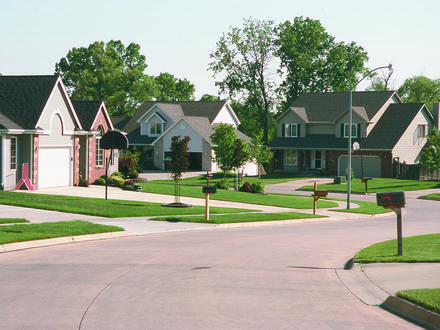
- Altoona、 アイオワ州
Altoonaのビジネス
産業
産業別事業分布 ショッピング: 20.6%
ホームサービス: 11.1%
医療: 10.1%
レストラン: 8.6%
産業: 7.3%
専門家のサービス: 6%
その他: 36.2%
| 業界の説明 | 事業所数 | ビジネスの平均年齢 | Googleの平均評価 | 住民1,000人あたりのビジネス |
|---|---|---|---|---|
| ガソリンスタンド | 11 | 52.5 年 | 3.8 | 0.7 |
| 自動車部品 | 10 | 37.7 年 | 4.0 | 0.6 |
| 車の修理 | 23 | 38.1 年 | 3.8 | 1.5 |
| ヘアサロン | 24 | 26.4 年 | 4.3 | 1.6 |
| 美容院 | 21 | 26.2 年 | 4.4 | 1.4 |
| 行政 | 11 | 74.7 年 | 3.8 | 0.7 |
| ATM | 20 | 65.8 年 | 4.0 | 1.3 |
| ローン会社 | 22 | 57.4 年 | 4.1 | 1.4 |
| 金融その他 | 17 | 157.3 年 | 3.8 | 1.1 |
| 銀行 | 14 | 64.1 年 | 3.9 | 0.9 |
| コンビニエンスストア | 11 | 70.7 年 | 3.8 | 0.7 |
| 食料雑貨品店・スーパーマーケット | 15 | 46.3 年 | 3.9 | 1.0 |
| その他の建設 | 12 | 29.4 年 | 4.2 | 0.8 |
| ゼネコン | 48 | 34.2 年 | 3.9 | 3.1 |
| マンション | 17 | 30.6 年 | 3.7 | 1.1 |
| 不動産 | 50 | 28.5 年 | 3.6 | 3.2 |
| その他の宿泊施設 | 15 | 35.2 年 | 3.9 | 1.0 |
| ホテル・モーテル | 15 | 32.8 年 | 3.9 | 1.0 |
| 建物の建設 | 26 | 42.4 年 | 3.9 | 1.7 |
| 建設資材の卸売 | 10 | 70.3 年 | 3.9 | 0.6 |
| 子供の保育・デイケア | 11 | 30.2 年 | 4.1 | 0.7 |
| カイロプラクティック | 14 | 25.3 年 | 5.0 | 0.9 |
| 一般開業医 | 11 | 31.8 年 | 4.6 | 0.7 |
| 保健医療 | 59 | 31.8 年 | 4.0 | 3.8 |
| 内科医と外科医 | 14 | 31.9 年 | 4.0 | 0.9 |
| 歯医者 | 16 | 30.2 年 | 4.9 | 1.0 |
| 理学療法 | 17 | 45.2 年 | 3.2 | 1.1 |
| 弁護士 | 16 | 27.3 年 | 4.4 | 1.0 |
| 教会 | 16 | 41.7 年 | 4.8 | 1.0 |
| アメリカ料理レストラン | 13 | 35.2 年 | 4.0 | 0.8 |
| ファーストフードレストラン | 12 | 43.8 年 | 3.6 | 0.8 |
| ショッピングその他 | 13 | 50.7 年 | 4.2 | 0.8 |
| 事務用品・文房具店 | 10 | 22.5 年 | 3.8 | 0.6 |
| 薬局・ドラッグストア | 21 | 52 年 | 3.7 | 1.4 |
| 電気店 | 17 | 28.8 年 | 3.8 | 1.1 |
| 公共公園 | 24 | 52.1 年 | 4.4 | 1.6 |
| Altoona、 アイオワ州の面積 | 9.35 mi² |
| 人口 | 15441 |
| 男性人口 | 7547 (48.9%) |
| 女性人口 | 7894 (51.1%) |
| 1975から2015にかけての人口の変動 | +17.9% |
| 2000から2015にかけての人口の変動 | +21.5% |
| 平均年齢 | 33.5 |
| 男性平均年齢 | 32.3 |
| 女性の平均年齢 | 34.7 |
| 市外局番 | 515 |
| 地域 | Adventure Village, Altoona, Corner Place, Eastpointe Parkway, Venbury, Venbury Square |
| 現地時間 | 日曜日 7:32 |
| 時間帯 | アメリカ中部夏時間 |
| 緯度と経度 | 41.64416° / -93.46466° |
| 郵便番号 | 50009 |
Altoona、 アイオワ州 - 地図
Altoona、 アイオワ州の人口
1975年から2015年まで| データ | 1975 | 1990 | 2000 | 2015 |
|---|---|---|---|---|
| 人口 | 13098 | 12900 | 12711 | 15441 |
| 人口密度 | 1400 / mi² | 1379 / mi² | 1359 / mi² | 1651 / mi² |
2000から2015にかけてのAltoonaの人口変動
2000年から2015年にかけての21.5%の増加| 場所 | 1975以来の変化 | 1990以来の変化 | 2000以来の変化 |
|---|---|---|---|
| Altoona、 アイオワ州 | +17.9% | +19.7% | +21.5% |
| アイオワ州 | +21% | +11.9% | +5% |
| アメリカ | +46.9% | +27.2% | +13.7% |
Altoona、 アイオワ州の年齢中央値
年齢中央値:33.5 年| 場所 | 平均年齢 | 年齢の中央値(女性) | 年齢の中央値(男性) |
|---|---|---|---|
| Altoona、 アイオワ州 | 33.5 年 | 34.7 年 | 32.3 年 |
| アイオワ州 | 38.2 年 | 39.6 年 | 36.7 年 |
| アメリカ | 37.4 年 | 38.7 年 | 36.1 年 |
Altoona、 アイオワ州の人口ピラミッド
年齢と性別による人口| 年齢 | 男性 | 女性 | 合計 |
|---|---|---|---|
| 5歳未満 | 714 | 629 | 1344 |
| 5-9 | 708 | 626 | 1334 |
| 10-14 | 641 | 643 | 1285 |
| 15-19 | 505 | 528 | 1033 |
| 20-24 | 424 | 381 | 806 |
| 25-29 | 509 | 545 | 1055 |
| 30-34 | 590 | 633 | 1224 |
| 35-39 | 642 | 621 | 1263 |
| 40-44 | 557 | 605 | 1163 |
| 45-49 | 538 | 565 | 1103 |
| 50-54 | 445 | 503 | 948 |
| 55-59 | 384 | 397 | 781 |
| 60-64 | 334 | 396 | 731 |
| 65-69 | 201 | 239 | 441 |
| 70-74 | 136 | 216 | 352 |
| 75-79 | 106 | 163 | 269 |
| 80-84 | 73 | 112 | 185 |
| 85プラス | 41 | 92 | 134 |
Altoona、 アイオワ州の人口密度
人口密度:1651 / mi²| 場所 | 人口 | エリア | 人口密度 |
|---|---|---|---|
| Altoona、 アイオワ州 | 15441 | 9.35 mi² | 1651 / mi² |
| アイオワ州 | 3.1 ミリオン | 56,273.1 mi² | 54.9 / mi² |
| アメリカ | 321.6 ミリオン | 3,796,761.2 mi² | 84.7 / mi² |
Altoona、 アイオワ州の予測人口
1975から2100にかけての推定人口Sources:
1. JRC (European Commission's Joint Research Centre) work on the GHS built-up grid
2. CIESIN (Center for International Earth Science Information Network)
3. [リンク] Klein Goldewijk, K., Beusen, A., Doelman, J., and Stehfest, E.: Anthropogenic land use estimates for the Holocene – HYDE 3.2, Earth Syst. Sci. Data, 9, 927–953, https://doi.org/10.5194/essd-9-927-2017, 2017.
地域
Altoonaの地区別のビジネスの分布 Altoona: 31.6%
Corner Place: 9.6%
Venbury: 8.8%
Venbury Square: 8.8%
Eastpointe Parkway: 5.3%
Adventure Village: 4.4%
その他: 31.6%
Altoona、 アイオワ州の価格によるビジネスの分布
適度な: 47.9%
安価な: 43.8%
高価な: 7.1%
非常に高価な: 1.2%
人間開発指数(HDI)
平均余命、教育、および一人当たり収入の統計的複合指数。Sources: [Link] Kummu, M., Taka, M. & Guillaume, J. Gridded global datasets for Gross Domestic Product and Human Development Index over 1990–2015. Sci Data 5, 180004 (2018) doi:10.1038/sdata.2018.4
Altoona、 アイオワ州の二酸化炭素排出量
1人あたりの二酸化炭素(CO2)排出量(年間トン)| 場所 | CO2排出量 | 一人当たりのCO2排出量 | CO2排出強度 |
|---|---|---|---|
| Altoona、 アイオワ州 | 276,225 s/t | 17.9 s/t | 29,538 米トン/mi² |
| アイオワ州 | 60,512,078 s/t | 19.6 s/t | 1,075 米トン/mi² |
| アメリカ | 5,664,619,809 s/t | 17.6 s/t | 1,491 米トン/mi² |
Altoona、 アイオワ州の二酸化炭素排出量
| 2013年の二酸化炭素排出量 (トン/年) | 276,225 s/t |
| 2013の人口1人あたりの二酸化炭素排出量 (トン/年) | 17.9 s/t |
| 2013年の二酸化炭素排出量 (トン/mi²/年) |
自然災害リスク
10のうちの相対リスク| 干ばつ | 低 (2) |
| 洪水 | 中 (4) |
*特に洪水または地滑りに関するリスクは、地域全体に及ぶとは限りません。
Sources: 1. Dilley, M., R.S. Chen, U. Deichmann, A.L. Lerner-Lam, M. Arnold, J. Agwe, P. Buys, O. Kjekstad, B. Lyon, and G. Yetman. 2005. Natural Disaster Hotspots: A Global Risk Analysis. Washington, D.C.: World Bank. https://doi.org/10.1596/0-8213-5930-4.
2. Center for Hazards and Risk Research - CHRR - Columbia University, Center for International Earth Science Information Network - CIESIN - Columbia University, and International Research Institute for Climate and Society - IRI - Columbia University. 2005. Global Drought Hazard Frequency and Distribution. Palisades, NY: NASA Socioeconomic Data and Applications Center (SEDAC). https://doi.org/10.7927/H4VX0DFT.
3. Center for Hazards and Risk Research - CHRR - Columbia University, Center for International Earth Science Information Network - CIESIN - Columbia University. 2005. Global Flood Hazard Frequency and Distribution. Palisades, NY: NASA Socioeconomic Data and Applications Center (SEDAC). https://doi.org/10.7927/H4668B3D.
データについて
このページのデータは、公開されている多くのツールとリソースを使用して推定されています。保証なしで提供され、不正確な内容が含まれている可能性があります。自己責任。詳細については、 こちらをご覧ください。