- 世界
- »
- US
- »
- テキサス州
- »
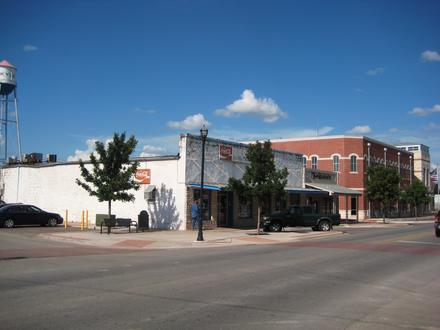
- Buda、 テキサス州
Budaのビジネス
産業
産業別事業分布 ショッピング: 16.9%
ホームサービス: 15%
産業: 12.3%
専門家のサービス: 11.2%
自動車: 7.1%
医療: 5.6%
レストラン: 5.3%
その他: 26.6%
| 業界の説明 | 事業所数 | ビジネスの平均年齢 | Googleの平均評価 | 住民1,000人あたりのビジネス |
|---|---|---|---|---|
| ガソリンスタンド | 24 | 46.3 年 | 3.9 | 2.7 |
| 自動車部品 | 27 | 30.7 年 | 3.9 | 3.0 |
| 車の修理 | 66 | 30.4 年 | 4.0 | 7.3 |
| ヘアサロン | 17 | 23.2 年 | 3.9 | 1.9 |
| 美容院 | 15 | 20.2 年 | 4.2 | 1.7 |
| 社会福祉 | 20 | 46.2 年 | 4.2 | 2.2 |
| 教育その他 | 20 | 28.1 年 | 4.1 | 2.2 |
| ATM | 15 | 3.5 | 1.7 | |
| ローン会社 | 36 | 38.1 年 | 4.4 | 4.0 |
| 金融その他 | 18 | 61.6 年 | 4.3 | 2.0 |
| 食料雑貨品店・スーパーマーケット | 22 | 34.2 年 | 4.1 | 2.4 |
| その他の建設 | 72 | 32.2 年 | 4.4 | 8.0 |
| エアコン設置・修理 | 17 | 28 年 | 4.5 | 1.9 |
| ゼネコン | 111 | 29.3 年 | 4.2 | 12.3 |
| 不動産 | 70 | 23.2 年 | 4.1 | 7.8 |
| 住宅の建設 | 22 | 26 年 | 4.0 | 2.4 |
| 造園 | 16 | 21.9 年 | 4.6 | 1.8 |
| 電気設備 | 17 | 21.4 年 | 4.3 | 1.9 |
| 卸売業者 | 16 | 31.2 年 | 4.2 | 1.8 |
| 土木工学 | 15 | 38 年 | 4.0 | 1.7 |
| 建物の建設 | 71 | 31.8 年 | 3.8 | 7.9 |
| 建設資材の卸売 | 27 | 30.1 年 | 4.0 | 3.0 |
| 機械の卸売 | 18 | 40.3 年 | 4.8 | 2.0 |
| 子供の保育・デイケア | 18 | 36.3 年 | 4.6 | 2.0 |
| 保健医療 | 67 | 22.7 年 | 4.6 | 7.4 |
| 企業マネジメント | 34 | 30.8 年 | 4.2 | 3.8 |
| 特殊デザイン | 18 | 23.3 年 | 4.8 | 2.0 |
| 科学・技術サービス | 25 | 31.5 年 | 4.6 | 2.8 |
| 経理 | 18 | 28.4 年 | 4.5 | 2.0 |
| 教会 | 29 | 34.8 年 | 4.8 | 3.2 |
| アメリカ料理レストラン | 16 | 32.2 年 | 4.2 | 1.8 |
| ショッピングその他 | 30 | 32.3 年 | 4.4 | 3.3 |
| 薬局・ドラッグストア | 16 | 67.2 年 | 4.4 | 1.8 |
| 金物店/ホームセンター | 26 | 35.6 年 | 4.1 | 2.9 |
| 電気店 | 19 | 31.3 年 | 4.0 | 2.1 |
| Buda、 テキサス州の面積 | 2.432 mi² |
| 人口 | 9030 |
| 男性人口 | 4363 (48.3%) |
| 女性人口 | 4667 (51.7%) |
| 1975から2015にかけての人口の変動 | +122.9% |
| 2000から2015にかけての人口の変動 | +99.4% |
| 平均年齢 | 32.9 |
| 男性平均年齢 | 32.4 |
| 女性の平均年齢 | 33.3 |
| 市外局番 | 512 |
| 地域 | Buda, Country Estates, Coves Of Cimmaron, Coves of Cimmaron, Hays Country Oaks, Leisurewoods |
| 現地時間 | 土曜日 23:49 |
| 時間帯 | アメリカ中部夏時間 |
| 緯度と経度 | 30.08521° / -97.84028° |
| 郵便番号 | 78610 |
Buda、 テキサス州 - 地図
Buda、 テキサス州の人口
1975年から2015年まで| データ | 1975 | 1990 | 2000 | 2015 |
|---|---|---|---|---|
| 人口 | 4051 | 4370 | 4528 | 9030 |
| 人口密度 | 1665 / mi² | 1796 / mi² | 1861 / mi² | 3712 / mi² |
2000から2015にかけてのBudaの人口変動
2000年から2015年にかけての99.4%の増加| 場所 | 1975以来の変化 | 1990以来の変化 | 2000以来の変化 |
|---|---|---|---|
| Buda、 テキサス州 | +122.9% | +106.6% | +99.4% |
| テキサス州 | +111% | +60.8% | +31.3% |
| アメリカ | +46.9% | +27.2% | +13.7% |
Buda、 テキサス州の年齢中央値
年齢中央値:32.9 年| 場所 | 平均年齢 | 年齢の中央値(女性) | 年齢の中央値(男性) |
|---|---|---|---|
| Buda、 テキサス州 | 32.9 年 | 33.3 年 | 32.4 年 |
| テキサス州 | 33.8 年 | 34.8 年 | 32.8 年 |
| アメリカ | 37.4 年 | 38.7 年 | 36.1 年 |
Buda、 テキサス州の人口ピラミッド
年齢と性別による人口| 年齢 | 男性 | 女性 | 合計 |
|---|---|---|---|
| 5歳未満 | 434 | 438 | 872 |
| 5-9 | 389 | 400 | 789 |
| 10-14 | 361 | 345 | 706 |
| 15-19 | 278 | 252 | 531 |
| 20-24 | 221 | 242 | 464 |
| 25-29 | 312 | 373 | 686 |
| 30-34 | 385 | 424 | 810 |
| 35-39 | 389 | 430 | 820 |
| 40-44 | 350 | 337 | 688 |
| 45-49 | 304 | 330 | 635 |
| 50-54 | 265 | 293 | 558 |
| 55-59 | 217 | 271 | 488 |
| 60-64 | 204 | 185 | 389 |
| 65-69 | 105 | 131 | 237 |
| 70-74 | 65 | 87 | 152 |
| 75-79 | 46 | 57 | 104 |
| 80-84 | 26 | 37 | 63 |
| 85プラス | 11 | 35 | 47 |
Buda、 テキサス州の人口密度
人口密度:3712 / mi²| 場所 | 人口 | エリア | 人口密度 |
|---|---|---|---|
| Buda、 テキサス州 | 9030 | 2.432 mi² | 3712 / mi² |
| テキサス州 | 27.5 ミリオン | 268,597.7 mi² | 102.5 / mi² |
| アメリカ | 321.6 ミリオン | 3,796,761.2 mi² | 84.7 / mi² |
Buda、 テキサス州の過去および将来の予測人口
1870から2100にかけての推定人口Sources:
1. JRC (European Commission's Joint Research Centre) work on the GHS built-up grid
2. CIESIN (Center for International Earth Science Information Network)
3. [リンク] Klein Goldewijk, K., Beusen, A., Doelman, J., and Stehfest, E.: Anthropogenic land use estimates for the Holocene – HYDE 3.2, Earth Syst. Sci. Data, 9, 927–953, https://doi.org/10.5194/essd-9-927-2017, 2017.
地域
Budaの地区別のビジネスの分布 Coves Of Cimmaron: 27.4%
Leisurewoods: 14.6%
Buda: 11%
Coves of Cimmaron: 5.9%
その他: 41.1%
Buda、 テキサス州の価格によるビジネスの分布
安価な: 45.3%
適度な: 41.8%
高価な: 8.8%
非常に高価な: 4.1%
人間開発指数(HDI)
平均余命、教育、および一人当たり収入の統計的複合指数。Sources: [Link] Kummu, M., Taka, M. & Guillaume, J. Gridded global datasets for Gross Domestic Product and Human Development Index over 1990–2015. Sci Data 5, 180004 (2018) doi:10.1038/sdata.2018.4
Buda、 テキサス州の二酸化炭素排出量
1人あたりの二酸化炭素(CO2)排出量(年間トン)| 場所 | CO2排出量 | 一人当たりのCO2排出量 | CO2排出強度 |
|---|---|---|---|
| Buda、 テキサス州 | 160,121 s/t | 17.7 s/t | 65,826 米トン/mi² |
| テキサス州 | 488,896,034 s/t | 17.8 s/t | 1,820 米トン/mi² |
| アメリカ | 5,664,619,809 s/t | 17.6 s/t | 1,491 米トン/mi² |
Buda、 テキサス州の二酸化炭素排出量
| 2013年の二酸化炭素排出量 (トン/年) | 160,121 s/t |
| 2013の人口1人あたりの二酸化炭素排出量 (トン/年) | 17.7 s/t |
| 2013年の二酸化炭素排出量 (トン/mi²/年) |
自然災害リスク
10のうちの相対リスク| 干ばつ | 低 (2) |
| 洪水 | 高 (9) |
*特に洪水または地滑りに関するリスクは、地域全体に及ぶとは限りません。
Sources: 1. Dilley, M., R.S. Chen, U. Deichmann, A.L. Lerner-Lam, M. Arnold, J. Agwe, P. Buys, O. Kjekstad, B. Lyon, and G. Yetman. 2005. Natural Disaster Hotspots: A Global Risk Analysis. Washington, D.C.: World Bank. https://doi.org/10.1596/0-8213-5930-4.
2. Center for Hazards and Risk Research - CHRR - Columbia University, Center for International Earth Science Information Network - CIESIN - Columbia University, and International Research Institute for Climate and Society - IRI - Columbia University. 2005. Global Drought Hazard Frequency and Distribution. Palisades, NY: NASA Socioeconomic Data and Applications Center (SEDAC). https://doi.org/10.7927/H4VX0DFT.
3. Center for Hazards and Risk Research - CHRR - Columbia University, Center for International Earth Science Information Network - CIESIN - Columbia University. 2005. Global Flood Hazard Frequency and Distribution. Palisades, NY: NASA Socioeconomic Data and Applications Center (SEDAC). https://doi.org/10.7927/H4668B3D.
最近の近くの地震
マグニチュード3.0以上| 日付 | 時間 | 大きさ | 距離 | 深さ | 場所 | リンク |
|---|---|---|---|---|---|---|
| 2019/05/14 | 3:52 | 3.1 | 90.7 km | 5,000 m | 10km E of Nixon, Texas | usgs.gov |

データについて
このページのデータは、公開されている多くのツールとリソースを使用して推定されています。保証なしで提供され、不正確な内容が含まれている可能性があります。自己責任。詳細については、 こちらをご覧ください。