- 世界
- »
- US
- »
- インディアナ州
- »
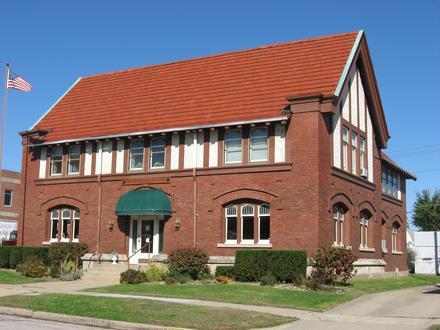
- Freelandville、 インディアナ州
Freelandvilleのビジネス
産業
産業別事業分布 医療: 20.7%
ショッピング: 13.8%
専門家のサービス: 13.8%
ホームサービス: 10.3%
産業: 6.9%
自動車: 6.9%
レストラン: 6.9%
地域のサービス: 6.9%
金融サービス: 6.9%
自治体: 6.9%
| Freelandville、 インディアナ州の面積 | 5.57 mi² |
| 人口 | 630 |
| 男性人口 | 301 (47.8%) |
| 女性人口 | 329 (52.2%) |
| 1975から2015にかけての人口の変動 | +48.9% |
| 2000から2015にかけての人口の変動 | -4.7% |
| 平均年齢 | 44.6 |
| 男性平均年齢 | 40.6 |
| 女性の平均年齢 | 48.2 |
| 市外局番 | 812 |
| 現地時間 | 日曜日 2:22 |
| 時間帯 | アメリカ東部夏時間 |
| 緯度と経度 | 38.86477° / -87.30585° |
| 郵便番号 | 47535 |
Freelandville、 インディアナ州 - 地図
Freelandville、 インディアナ州の人口
1975年から2015年まで| データ | 1975 | 1990 | 2000 | 2015 |
|---|---|---|---|---|
| 人口 | 423 | 538 | 661 | 630 |
| 人口密度 | 75.9 / mi² | 96.6 / mi² | 118.7 / mi² | 113.1 / mi² |
2000から2015にかけてのFreelandvilleの人口変動
2000年から2015年にかけての4.7%の低下| 場所 | 1975以来の変化 | 1990以来の変化 | 2000以来の変化 |
|---|---|---|---|
| Freelandville、 インディアナ州 | +48.9% | +17.1% | -4.7% |
| インディアナ州 | +33.4% | +18.8% | +8.8% |
| アメリカ | +46.9% | +27.2% | +13.7% |
Freelandville、 インディアナ州の年齢中央値
年齢中央値:44.6 年| 場所 | 平均年齢 | 年齢の中央値(女性) | 年齢の中央値(男性) |
|---|---|---|---|
| Freelandville、 インディアナ州 | 44.6 年 | 48.2 年 | 40.6 年 |
| インディアナ州 | 37 年 | 38.2 年 | 35.8 年 |
| アメリカ | 37.4 年 | 38.7 年 | 36.1 年 |
Freelandville、 インディアナ州の人口ピラミッド
年齢と性別による人口| 年齢 | 男性 | 女性 | 合計 |
|---|---|---|---|
| 5歳未満 | 14 | 23 | 38 |
| 5-9 | 23 | 14 | 37 |
| 10-14 | 13 | 17 | 30 |
| 15-19 | 17 | 19 | 36 |
| 20-24 | 20 | 18 | 38 |
| 25-29 | 23 | 19 | 43 |
| 30-34 | 19 | 13 | 33 |
| 35-39 | 19 | 15 | 35 |
| 40-44 | 13 | 15 | 28 |
| 45-49 | 20 | 19 | 40 |
| 50-54 | 20 | 17 | 37 |
| 55-59 | 24 | 23 | 48 |
| 60-64 | 18 | 22 | 41 |
| 65-69 | 19 | 26 | 45 |
| 70-74 | 13 | 15 | 29 |
| 75-79 | 11 | 20 | 31 |
| 80-84 | 6 | 14 | 20 |
| 85プラス | 8 | 21 | 30 |
Freelandville、 インディアナ州の人口密度
人口密度:113.1 / mi²| 場所 | 人口 | エリア | 人口密度 |
|---|---|---|---|
| Freelandville、 インディアナ州 | 630 | 5.57 mi² | 113.1 / mi² |
| インディアナ州 | 6.6 ミリオン | 36,419.7 mi² | 182.5 / mi² |
| アメリカ | 321.6 ミリオン | 3,796,761.2 mi² | 84.7 / mi² |
人間開発指数(HDI)
平均余命、教育、および一人当たり収入の統計的複合指数。Sources: [Link] Kummu, M., Taka, M. & Guillaume, J. Gridded global datasets for Gross Domestic Product and Human Development Index over 1990–2015. Sci Data 5, 180004 (2018) doi:10.1038/sdata.2018.4
Freelandville、 インディアナ州の二酸化炭素排出量
1人あたりの二酸化炭素(CO2)排出量(年間トン)| 場所 | CO2排出量 | 一人当たりのCO2排出量 | CO2排出強度 |
|---|---|---|---|
| Freelandville、 インディアナ州 | 12,768 s/t | 20.3 s/t | 2,292 米トン/mi² |
| インディアナ州 | 127,126,225 s/t | 19.1 s/t | 3,490 米トン/mi² |
| アメリカ | 5,664,619,809 s/t | 17.6 s/t | 1,491 米トン/mi² |
Freelandville、 インディアナ州の二酸化炭素排出量
| 2013年の二酸化炭素排出量 (トン/年) | 12,768 s/t |
| 2013の人口1人あたりの二酸化炭素排出量 (トン/年) | 20.3 s/t |
| 2013年の二酸化炭素排出量 (トン/mi²/年) |
自然災害リスク
10のうちの相対リスク| 洪水 | 高 (9) |
| 地震 | 中 (2.7) |
*特に洪水または地滑りに関するリスクは、地域全体に及ぶとは限りません。
Sources: 1. Dilley, M., R.S. Chen, U. Deichmann, A.L. Lerner-Lam, M. Arnold, J. Agwe, P. Buys, O. Kjekstad, B. Lyon, and G. Yetman. 2005. Natural Disaster Hotspots: A Global Risk Analysis. Washington, D.C.: World Bank. https://doi.org/10.1596/0-8213-5930-4.
2. Center for Hazards and Risk Research - CHRR - Columbia University, Center for International Earth Science Information Network - CIESIN - Columbia University. 2005. Global Earthquake Hazard Distribution - Peak Ground Acceleration. Palisades, NY: NASA Socioeconomic Data and Applications Center (SEDAC). https://doi.org/10.7927/H4BZ63ZS.
3. Center for Hazards and Risk Research - CHRR - Columbia University, Center for International Earth Science Information Network - CIESIN - Columbia University. 2005. Global Flood Hazard Frequency and Distribution. Palisades, NY: NASA Socioeconomic Data and Applications Center (SEDAC). https://doi.org/10.7927/H4668B3D.
最近の近くの地震
マグニチュード3.0以上| 日付 | 時間 | 大きさ | 距離 | 深さ | 場所 | リンク |
|---|---|---|---|---|---|---|
| 2017/09/19 | 4:47 | 3.8 | 71.8 km | 11,680 m | 13km W of Mount Carmel, Illinois | usgs.gov |
| 2017/09/08 | 21:15 | 3.06 | 72 km | 11,760 m | 13km W of Mount Carmel, Illinois | usgs.gov |
| 2012/11/20 | 15:28 | 3.6 | 69 km | 18,560 m | 13km WNW of Mount Carmel, Illinois | usgs.gov |
| 2012/05/10 | 15:54 | 3.1 | 14.9 km | 10,700 m | 13km WNW of Bicknell, Indiana | usgs.gov |
| 2008/07/17 | 19:58 | 3.1 | 69.5 km | 18,280 m | 12km WNW of Mount Carmel, Illinois | usgs.gov |
| 2008/06/05 | 0:13 | 3.4 | 65.4 km | 16,239 m | 8km WNW of Mount Carmel, Illinois | usgs.gov |
| 2008/04/30 | 22:30 | 3.3 | 66.4 km | 14,320 m | 9km WNW of Mount Carmel, Illinois | usgs.gov |
| 2008/04/25 | 10:31 | 3.7 | 67.5 km | 12,980 m | 10km WNW of Mount Carmel, Illinois | usgs.gov |
| 2008/04/20 | 22:38 | 4 | 67.9 km | 18,290 m | 10km WNW of Mount Carmel, Illinois | usgs.gov |
| 2008/04/18 | 8:14 | 4.7 | 66.6 km | 15,460 m | 10km WNW of Mount Carmel, Illinois | usgs.gov |
Freelandville、 インディアナ州付近で発生した過去の地震の検索
最も早い日付 最新の日付
マグニチュード3.0以上 マグニチュード4.0以上 マグニチュード5.0以上
データについて
このページのデータは、公開されている多くのツールとリソースを使用して推定されています。保証なしで提供され、不正確な内容が含まれている可能性があります。自己責任。詳細については、 こちらをご覧ください。