- 世界
- »
- US
- »
- ネブラスカ州
- »
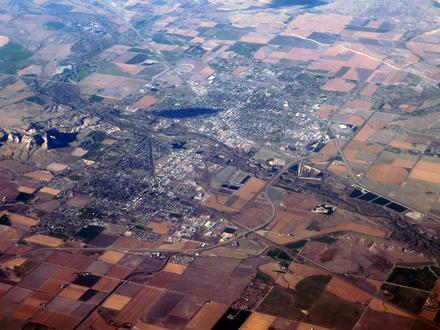
- Gering、 ネブラスカ州
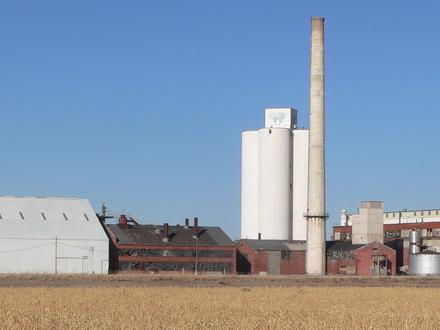
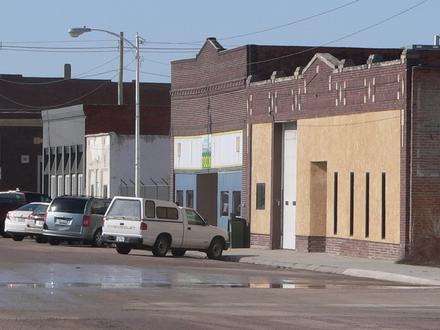
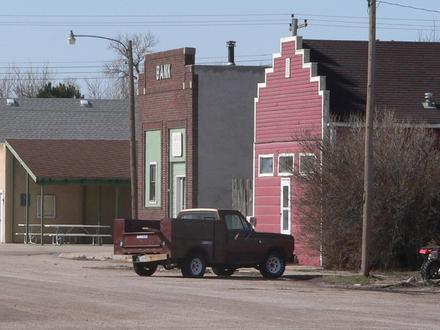
Geringのビジネス
産業
産業別事業分布 産業: 12.9%
ショッピング: 11.9%
専門家のサービス: 9.2%
ホームサービス: 8.2%
自治体: 8%
医療: 6.9%
レストラン: 6.8%
地域のサービス: 6.6%
自動車: 5.7%
金融サービス: 5.2%
その他: 18.4%
| 業界の説明 | 事業所数 | ビジネスの平均年齢 | Googleの平均評価 | 住民1,000人あたりのビジネス |
|---|---|---|---|---|
| 自動車部品 | 8 | 29.5 年 | 4.4 | 1.0 |
| 車の修理 | 17 | 31 年 | 4.5 | 2.1 |
| ヘアサロン | 10 | 36.6 年 | 4.1 | 1.2 |
| 美容院 | 8 | 32.8 年 | 4.0 | 1.0 |
| 政府機関 | 11 | 40.9 年 | 3.7 | 1.3 |
| 社会福祉 | 21 | 34.7 年 | 4.2 | 2.6 |
| 行政 | 53 | 39.4 年 | 2.5 | 6.4 |
| 裁判所 | 11 | 45.2 年 | 1.9 | 1.3 |
| 警察・法執行機関 | 7 | 1.0 | 0.9 | |
| 軍の | 7 | 57.7 年 | 1.0 | 0.9 |
| 小学校 | 8 | 39.4 年 | 3.4 | 1.0 |
| ATM | 8 | 4.6 | 1.0 | |
| ローン会社 | 9 | 50.4 年 | 2.0 | 1.1 |
| 金融その他 | 8 | 29.5 年 | 4.6 | 1.0 |
| 銀行 | 10 | 38.4 年 | 4.8 | 1.2 |
| 食料雑貨品店・スーパーマーケット | 8 | 31.5 年 | 4.4 | 1.0 |
| その他の建設 | 17 | 31.5 年 | 4.5 | 2.1 |
| ゼネコン | 33 | 42.6 年 | 4.6 | 4.0 |
| 不動産 | 15 | 29.4 年 | 3.3 | 1.8 |
| 屋根工事 | 7 | 38.4 年 | 5.0 | 0.9 |
| 引っ越し業者 | 10 | 31.3 年 | 4.1 | 1.2 |
| 造園 | 7 | 29.1 年 | 4.2 | 0.9 |
| 電気設備 | 7 | 40.8 年 | 3.0 | 0.9 |
| その他の会員組織 | 10 | 37.2 年 | 4.5 | 1.2 |
| 倉庫・保管 | 9 | 27.9 年 | 3.4 | 1.1 |
| 卸売業者 | 7 | 45.5 年 | 4.5 | 0.9 |
| 建物の建設 | 17 | 43.8 年 | 4.7 | 2.1 |
| 建設資材の卸売 | 10 | 43 年 | 4.5 | 1.2 |
| 機械の卸売 | 20 | 33.7 年 | 4.3 | 2.4 |
| 貨物/民間輸送 | 11 | 31.3 年 | 4.1 | 1.3 |
| パーソナルサービス | 7 | 27.4 年 | 4.0 | 0.9 |
| 子供の保育・デイケア | 10 | 30.7 年 | 4.1 | 1.2 |
| カイロプラクティック | 7 | 5.0 | 0.9 | |
| 保健医療 | 35 | 36.6 年 | 3.8 | 4.3 |
| 内科医と外科医 | 7 | 4.0 | 0.9 | |
| 歯医者 | 10 | 34.1 年 | 4.1 | 1.2 |
| 弁護士 | 16 | 34.6 年 | 2.6 | 1.9 |
| 科学・技術サービス | 8 | 29.5 年 | 5.0 | 1.0 |
| 経理 | 16 | 34.7 年 | 1.0 | 1.9 |
| 教会 | 19 | 49.4 年 | 4.8 | 2.3 |
| バー・パブ・居酒屋 | 10 | 33.3 年 | 4.4 | 1.2 |
| ショッピングその他 | 7 | 36.1 年 | 4.6 | 0.9 |
| 家電製品・グッズ | 7 | 37.1 年 | 4.4 | 0.9 |
| 金物店/ホームセンター | 8 | 4.1 | 1.0 | |
| 電気店 | 8 | 24.3 年 | 4.6 | 1.0 |
| 公共公園 | 13 | 4.5 | 1.6 |
| Gering、 ネブラスカ州の面積 | 4.301 mi² |
| 人口 | 8223 |
| 男性人口 | 3893 (47.3%) |
| 女性人口 | 4330 (52.7%) |
| 1975から2015にかけての人口の変動 | +39.2% |
| 2000から2015にかけての人口の変動 | -1.7% |
| 平均年齢 | 40 |
| 男性平均年齢 | 36.8 |
| 女性の平均年齢 | 42.9 |
| 市外局番 | 308 |
| 地域 | Scottsbluff |
| 現地時間 | 月曜日 5:55 |
| 時間帯 | アメリカ山地夏時間 |
| 緯度と経度 | 41.8258° / -103.6605° |
Gering、 ネブラスカ州 - 地図
Gering、 ネブラスカ州の人口
1975年から2015年まで| データ | 1975 | 1990 | 2000 | 2015 |
|---|---|---|---|---|
| 人口 | 5906 | 7189 | 8362 | 8223 |
| 人口密度 | 1373 / mi² | 1671 / mi² | 1944 / mi² | 1911 / mi² |
2000から2015にかけてのGeringの人口変動
2000年から2015年にかけての1.7%の低下| 場所 | 1975以来の変化 | 1990以来の変化 | 2000以来の変化 |
|---|---|---|---|
| Gering、 ネブラスカ州 | +39.2% | +14.4% | -1.7% |
| ネブラスカ州 | +32.9% | +19% | +8.9% |
| アメリカ | +46.9% | +27.2% | +13.7% |
Gering、 ネブラスカ州の年齢中央値
年齢中央値:40 年| 場所 | 平均年齢 | 年齢の中央値(女性) | 年齢の中央値(男性) |
|---|---|---|---|
| Gering、 ネブラスカ州 | 40 年 | 42.9 年 | 36.8 年 |
| ネブラスカ州 | 36.3 年 | 37.5 年 | 35.1 年 |
| アメリカ | 37.4 年 | 38.7 年 | 36.1 年 |
Gering、 ネブラスカ州の人口ピラミッド
年齢と性別による人口| 年齢 | 男性 | 女性 | 合計 |
|---|---|---|---|
| 5歳未満 | 314 | 286 | 601 |
| 5-9 | 318 | 274 | 593 |
| 10-14 | 260 | 247 | 507 |
| 15-19 | 255 | 262 | 518 |
| 20-24 | 218 | 220 | 439 |
| 25-29 | 255 | 281 | 537 |
| 30-34 | 242 | 239 | 481 |
| 35-39 | 236 | 218 | 455 |
| 40-44 | 193 | 233 | 427 |
| 45-49 | 243 | 276 | 519 |
| 50-54 | 260 | 261 | 522 |
| 55-59 | 288 | 324 | 612 |
| 60-64 | 226 | 285 | 511 |
| 65-69 | 164 | 207 | 371 |
| 70-74 | 132 | 169 | 301 |
| 75-79 | 106 | 160 | 266 |
| 80-84 | 114 | 188 | 303 |
| 85プラス | 69 | 200 | 269 |
Gering、 ネブラスカ州の人口密度
人口密度:1911 / mi²| 場所 | 人口 | エリア | 人口密度 |
|---|---|---|---|
| Gering、 ネブラスカ州 | 8223 | 4.301 mi² | 1911 / mi² |
| ネブラスカ州 | 1.9 ミリオン | 77,347.8 mi² | 24.2 / mi² |
| アメリカ | 321.6 ミリオン | 3,796,761.2 mi² | 84.7 / mi² |
Gering、 ネブラスカ州の歴史的人口
1870から2015にかけての推定人口Sources:
1. JRC (European Commission's Joint Research Centre) work on the GHS built-up grid
2. CIESIN (Center for International Earth Science Information Network)
3. [リンク] Klein Goldewijk, K., Beusen, A., Doelman, J., and Stehfest, E.: Anthropogenic land use estimates for the Holocene – HYDE 3.2, Earth Syst. Sci. Data, 9, 927–953, https://doi.org/10.5194/essd-9-927-2017, 2017.
Gering、 ネブラスカ州の価格によるビジネスの分布
安価な: 49.1%
適度な: 43.6%
高価な: 5.5%
非常に高価な: 1.8%
人間開発指数(HDI)
平均余命、教育、および一人当たり収入の統計的複合指数。Sources: [Link] Kummu, M., Taka, M. & Guillaume, J. Gridded global datasets for Gross Domestic Product and Human Development Index over 1990–2015. Sci Data 5, 180004 (2018) doi:10.1038/sdata.2018.4
Gering、 ネブラスカ州の二酸化炭素排出量
1人あたりの二酸化炭素(CO2)排出量(年間トン)| 場所 | CO2排出量 | 一人当たりのCO2排出量 | CO2排出強度 |
|---|---|---|---|
| Gering、 ネブラスカ州 | 155,236 s/t | 18.9 s/t | 36,091 米トン/mi² |
| ネブラスカ州 | 38,508,417 s/t | 20.5 s/t | 497.9 米トン/mi² |
| アメリカ | 5,664,619,809 s/t | 17.6 s/t | 1,491 米トン/mi² |
Gering、 ネブラスカ州の二酸化炭素排出量
| 2013年の二酸化炭素排出量 (トン/年) | 155,236 s/t |
| 2013の人口1人あたりの二酸化炭素排出量 (トン/年) | 18.9 s/t |
| 2013年の二酸化炭素排出量 (トン/mi²/年) |
自然災害リスク
10のうちの相対リスク| 干ばつ | 高 (7) |
*特に洪水または地滑りに関するリスクは、地域全体に及ぶとは限りません。
Sources: 1. Dilley, M., R.S. Chen, U. Deichmann, A.L. Lerner-Lam, M. Arnold, J. Agwe, P. Buys, O. Kjekstad, B. Lyon, and G. Yetman. 2005. Natural Disaster Hotspots: A Global Risk Analysis. Washington, D.C.: World Bank. https://doi.org/10.1596/0-8213-5930-4.
2. Center for Hazards and Risk Research - CHRR - Columbia University, Center for International Earth Science Information Network - CIESIN - Columbia University, and International Research Institute for Climate and Society - IRI - Columbia University. 2005. Global Drought Hazard Frequency and Distribution. Palisades, NY: NASA Socioeconomic Data and Applications Center (SEDAC). https://doi.org/10.7927/H4VX0DFT.
データについて
このページのデータは、公開されている多くのツールとリソースを使用して推定されています。保証なしで提供され、不正確な内容が含まれている可能性があります。自己責任。詳細については、 こちらをご覧ください。