- 世界
- »
- US
- »
- テキサス州
- »
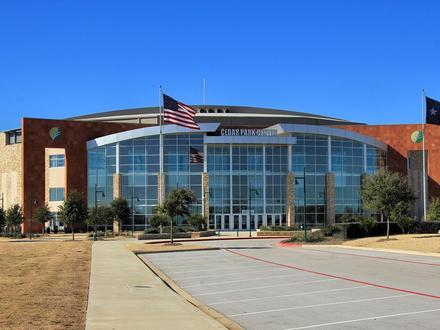
- Leander、 テキサス州
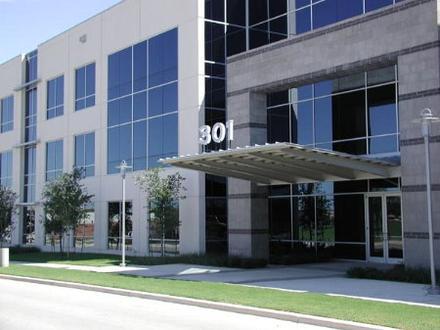
Leanderのビジネス
産業
産業別事業分布 ホームサービス: 16.8%
ショッピング: 14.9%
専門家のサービス: 12.5%
産業: 11.3%
医療: 6.2%
自動車: 5.5%
地域のサービス: 5.2%
その他: 27.6%
| 業界の説明 | 事業所数 | ビジネスの平均年齢 | Googleの平均評価 | 住民1,000人あたりのビジネス |
|---|---|---|---|---|
| ガソリンスタンド | 25 | 38.7 年 | 4.4 | 0.7 |
| 自動車部品 | 24 | 30.8 年 | 4.2 | 0.7 |
| 車の修理 | 71 | 27.2 年 | 4.1 | 2.1 |
| 美容院 | 24 | 21.1 年 | 4.2 | 0.7 |
| ローン会社 | 27 | 19.3 年 | 3.7 | 0.8 |
| 食料雑貨品店・スーパーマーケット | 23 | 36.4 年 | 4.4 | 0.7 |
| その他の建設 | 108 | 28.1 年 | 4.6 | 3.1 |
| エアコン設置・修理 | 31 | 27 年 | 4.4 | 0.9 |
| ゼネコン | 203 | 27.3 年 | 4.5 | 5.9 |
| プール&スパ請負業者 | 23 | 21.6 年 | 4.7 | 0.7 |
| 不動産 | 103 | 25.4 年 | 4.1 | 3.0 |
| 住宅の建設 | 38 | 33.1 年 | 4.2 | 1.1 |
| 大掃除サービス | 24 | 18 年 | 4.7 | 0.7 |
| 屋根工事 | 22 | 21.4 年 | 4.4 | 0.6 |
| 造園 | 38 | 30.9 年 | 4.5 | 1.1 |
| 電気設備 | 34 | 26.7 年 | 4.5 | 1.0 |
| 建物の建設 | 118 | 31.7 年 | 4.4 | 3.4 |
| 建設資材の卸売 | 27 | 34.7 年 | 3.9 | 0.8 |
| 機械の卸売 | 28 | 28.3 年 | 4.2 | 0.8 |
| 写真 | 35 | 18.7 年 | 4.7 | 1.0 |
| 保健医療 | 85 | 24 年 | 4.5 | 2.5 |
| 歯医者 | 26 | 21.5 年 | 4.8 | 0.8 |
| 企業マネジメント | 57 | 23.8 年 | 4.7 | 1.7 |
| 特殊デザイン | 40 | 21.3 年 | 4.4 | 1.2 |
| 科学・技術サービス | 55 | 21.7 年 | 4.9 | 1.6 |
| 教会 | 42 | 28.5 年 | 4.7 | 1.2 |
| ショッピングその他 | 25 | 35.7 年 | 4.1 | 0.7 |
| 金物店/ホームセンター | 40 | 27.8 年 | 4.3 | 1.2 |
| 電気店 | 29 | 33.2 年 | 4.4 | 0.8 |
| Leander、 テキサス州の面積 | 7.49 mi² |
| 人口 | 34335 |
| 男性人口 | 16940 (49.3%) |
| 女性人口 | 17395 (50.7%) |
| 1975から2015にかけての人口の変動 | +41% |
| 2000から2015にかけての人口の変動 | +112% |
| 平均年齢 | 31.6 |
| 男性平均年齢 | 31.1 |
| 女性の平均年齢 | 32.1 |
| 市外局番 | 512 |
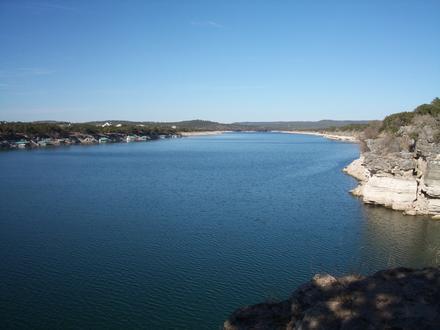
| 地域 | Block House Creek, Cherry Hollow Estates, Lake Travis, Leander, Leander Hills, North Rim, Round Mountain Oaks, Sandy Creek Ranches |
| 現地時間 | 土曜日 23:49 |
| 時間帯 | アメリカ中部夏時間 |
| 緯度と経度 | 30.57881° / -97.85307° |
| 郵便番号 | 78641, 78645, 78646 |
Leander、 テキサス州 - 地図
Leander、 テキサス州の人口
1975年から2015年まで| データ | 1975 | 1990 | 2000 | 2015 |
|---|---|---|---|---|
| 人口 | 24356 | 18716 | 16193 | 34335 |
| 人口密度 | 3251 / mi² | 2498 / mi² | 2161 / mi² | 4583 / mi² |
2000から2015にかけてのLeanderの人口変動
2000年から2015年にかけての112%の増加| 場所 | 1975以来の変化 | 1990以来の変化 | 2000以来の変化 |
|---|---|---|---|
| Leander、 テキサス州 | +41% | +83.5% | +112% |
| テキサス州 | +111% | +60.8% | +31.3% |
| アメリカ | +46.9% | +27.2% | +13.7% |
Leander、 テキサス州の年齢中央値
年齢中央値:31.6 年| 場所 | 平均年齢 | 年齢の中央値(女性) | 年齢の中央値(男性) |
|---|---|---|---|
| Leander、 テキサス州 | 31.6 年 | 32.1 年 | 31.1 年 |
| テキサス州 | 33.8 年 | 34.8 年 | 32.8 年 |
| アメリカ | 37.4 年 | 38.7 年 | 36.1 年 |
Leander、 テキサス州の人口ピラミッド
年齢と性別による人口| 年齢 | 男性 | 女性 | 合計 |
|---|---|---|---|
| 5歳未満 | 1556 | 1651 | 3207 |
| 5-9 | 1804 | 1724 | 3529 |
| 10-14 | 1688 | 1484 | 3173 |
| 15-19 | 1341 | 1154 | 2496 |
| 20-24 | 670 | 720 | 1391 |
| 25-29 | 1069 | 1269 | 2338 |
| 30-34 | 1484 | 1644 | 3129 |
| 35-39 | 1714 | 1769 | 3483 |
| 40-44 | 1470 | 1456 | 2926 |
| 45-49 | 1226 | 1208 | 2434 |
| 50-54 | 955 | 926 | 1881 |
| 55-59 | 732 | 803 | 1536 |
| 60-64 | 503 | 612 | 1116 |
| 65-69 | 311 | 382 | 694 |
| 70-74 | 169 | 233 | 403 |
| 75-79 | 125 | 154 | 279 |
| 80-84 | 83 | 110 | 193 |
| 85プラス | 37 | 98 | 135 |
Leander、 テキサス州の人口密度
人口密度:4583 / mi²| 場所 | 人口 | エリア | 人口密度 |
|---|---|---|---|
| Leander、 テキサス州 | 34335 | 7.49 mi² | 4583 / mi² |
| テキサス州 | 27.5 ミリオン | 268,597.7 mi² | 102.5 / mi² |
| アメリカ | 321.6 ミリオン | 3,796,761.2 mi² | 84.7 / mi² |
Leander、 テキサス州の予測人口
1975から2100にかけての推定人口Sources:
1. JRC (European Commission's Joint Research Centre) work on the GHS built-up grid
2. CIESIN (Center for International Earth Science Information Network)
3. [リンク] Klein Goldewijk, K., Beusen, A., Doelman, J., and Stehfest, E.: Anthropogenic land use estimates for the Holocene – HYDE 3.2, Earth Syst. Sci. Data, 9, 927–953, https://doi.org/10.5194/essd-9-927-2017, 2017.
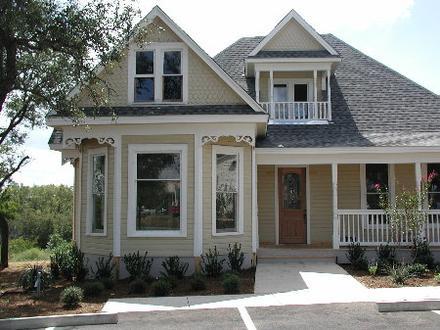
地域
Leanderの地区別のビジネスの分布 Block House Creek: 23.7%
Sandy Creek Ranches: 7.3%
その他: 69%
Leander、 テキサス州の価格によるビジネスの分布
適度な: 51.7%
安価な: 36.6%
高価な: 9.3%
非常に高価な: 2.4%
人間開発指数(HDI)
平均余命、教育、および一人当たり収入の統計的複合指数。Sources: [Link] Kummu, M., Taka, M. & Guillaume, J. Gridded global datasets for Gross Domestic Product and Human Development Index over 1990–2015. Sci Data 5, 180004 (2018) doi:10.1038/sdata.2018.4
Leander、 テキサス州の二酸化炭素排出量
1人あたりの二酸化炭素(CO2)排出量(年間トン)| 場所 | CO2排出量 | 一人当たりのCO2排出量 | CO2排出強度 |
|---|---|---|---|
| Leander、 テキサス州 | 635,649 s/t | 18.5 s/t | 84,861 米トン/mi² |
| テキサス州 | 488,896,034 s/t | 17.8 s/t | 1,820 米トン/mi² |
| アメリカ | 5,664,619,809 s/t | 17.6 s/t | 1,491 米トン/mi² |
Leander、 テキサス州の二酸化炭素排出量
| 2013年の二酸化炭素排出量 (トン/年) | 635,649 s/t |
| 2013の人口1人あたりの二酸化炭素排出量 (トン/年) | 18.5 s/t |
| 2013年の二酸化炭素排出量 (トン/mi²/年) |
自然災害リスク
10のうちの相対リスク| 干ばつ | 低 (2) |
| 洪水 | 高 (9) |
*特に洪水または地滑りに関するリスクは、地域全体に及ぶとは限りません。
Sources: 1. Dilley, M., R.S. Chen, U. Deichmann, A.L. Lerner-Lam, M. Arnold, J. Agwe, P. Buys, O. Kjekstad, B. Lyon, and G. Yetman. 2005. Natural Disaster Hotspots: A Global Risk Analysis. Washington, D.C.: World Bank. https://doi.org/10.1596/0-8213-5930-4.
2. Center for Hazards and Risk Research - CHRR - Columbia University, Center for International Earth Science Information Network - CIESIN - Columbia University, and International Research Institute for Climate and Society - IRI - Columbia University. 2005. Global Drought Hazard Frequency and Distribution. Palisades, NY: NASA Socioeconomic Data and Applications Center (SEDAC). https://doi.org/10.7927/H4VX0DFT.
3. Center for Hazards and Risk Research - CHRR - Columbia University, Center for International Earth Science Information Network - CIESIN - Columbia University. 2005. Global Flood Hazard Frequency and Distribution. Palisades, NY: NASA Socioeconomic Data and Applications Center (SEDAC). https://doi.org/10.7927/H4668B3D.
郵便番号
Leanderの郵便番号別のビジネスの割合 郵便番号 78641: 89.8%
郵便番号 78645: 6.7%
その他: 3.5%
データについて
このページのデータは、公開されている多くのツールとリソースを使用して推定されています。保証なしで提供され、不正確な内容が含まれている可能性があります。自己責任。詳細については、 こちらをご覧ください。