- 世界
- »
- US
- »
- オレゴン州
- »
- Lents、 オレゴン州
Lentsのビジネス
産業
産業別事業分布 医療: 33.9%
ホームサービス: 19.3%
専門家のサービス: 12.5%
産業: 8.9%
ショッピング: 8.3%
自動車: 4.7%
その他: 12.5%
| Lents、 オレゴン州の面積 | 3.566 mi² |
| 人口 | 21584 |
| 男性人口 | 10821 (50.1%) |
| 女性人口 | 10762 (49.9%) |
| 1975から2015にかけての人口の変動 | +126.3% |
| 2000から2015にかけての人口の変動 | +15.6% |
| 平均年齢 | 33.8 |
| 男性平均年齢 | 33.8 |
| 女性の平均年齢 | 33.9 |
| 現地時間 | 土曜日 23:42 |
| 時間帯 | アメリカ太平洋夏時間 |
| 緯度と経度 | 45.47984° / -122.56731° |
| 郵便番号 | 97266 |
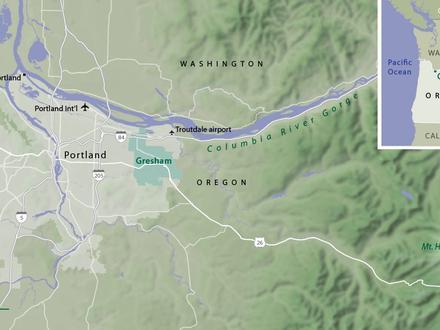
Lents、 オレゴン州 - 地図
Lents、 オレゴン州の人口
1975年から2015年まで| データ | 1975 | 1990 | 2000 | 2015 |
|---|---|---|---|---|
| 人口 | 9538 | 15087 | 18672 | 21584 |
| 人口密度 | 2674 / mi² | 4230 / mi² | 5236 / mi² | 6052 / mi² |
2000から2015にかけてのLentsの人口変動
2000年から2015年にかけての15.6%の増加| 場所 | 1975以来の変化 | 1990以来の変化 | 2000以来の変化 |
|---|---|---|---|
| Lents、 オレゴン州 | +126.3% | +43.1% | +15.6% |
| ポートランド | +126.6% | +43.1% | +15.7% |
| オレゴン州 | +65% | +34.6% | +16.8% |
| アメリカ | +46.9% | +27.2% | +13.7% |
Lents、 オレゴン州の年齢中央値
年齢中央値:33.8 年| 場所 | 平均年齢 | 年齢の中央値(女性) | 年齢の中央値(男性) |
|---|---|---|---|
| Lents、 オレゴン州 | 33.8 年 | 33.9 年 | 33.8 年 |
| ポートランド | 36 年 | 36.3 年 | 35.7 年 |
| オレゴン州 | 38.5 年 | 39.6 年 | 37.3 年 |
| アメリカ | 37.4 年 | 38.7 年 | 36.1 年 |
Lents、 オレゴン州の人口ピラミッド
年齢と性別による人口| 年齢 | 男性 | 女性 | 合計 |
|---|---|---|---|
| 5歳未満 | 835 | 849 | 1684 |
| 5-9 | 738 | 744 | 1482 |
| 10-14 | 720 | 644 | 1365 |
| 15-19 | 787 | 689 | 1477 |
| 20-24 | 738 | 727 | 1465 |
| 25-29 | 874 | 1018 | 1892 |
| 30-34 | 951 | 906 | 1858 |
| 35-39 | 847 | 762 | 1610 |
| 40-44 | 851 | 728 | 1579 |
| 45-49 | 780 | 660 | 1440 |
| 50-54 | 724 | 712 | 1437 |
| 55-59 | 671 | 656 | 1327 |
| 60-64 | 411 | 478 | 890 |
| 65-69 | 311 | 358 | 670 |
| 70-74 | 212 | 258 | 471 |
| 75-79 | 173 | 211 | 385 |
| 80-84 | 100 | 189 | 289 |
| 85プラス | 99 | 173 | 272 |
Lents、 オレゴン州の人口密度
人口密度:6052 / mi²| 場所 | 人口 | エリア | 人口密度 |
|---|---|---|---|
| Lents、 オレゴン州 | 21584 | 3.566 mi² | 6052 / mi² |
| ポートランド | 607761 | 145.1 mi² | 4188 / mi² |
| オレゴン州 | 4.0 ミリオン | 98,379.3 mi² | 40.8 / mi² |
| アメリカ | 321.6 ミリオン | 3,796,761.2 mi² | 84.7 / mi² |
Lents、 オレゴン州の過去および将来の予測人口
1890から2100にかけての推定人口Sources:
1. JRC (European Commission's Joint Research Centre) work on the GHS built-up grid
2. CIESIN (Center for International Earth Science Information Network)
3. [リンク] Klein Goldewijk, K., Beusen, A., Doelman, J., and Stehfest, E.: Anthropogenic land use estimates for the Holocene – HYDE 3.2, Earth Syst. Sci. Data, 9, 927–953, https://doi.org/10.5194/essd-9-927-2017, 2017.
地域
Lentsの地区別のビジネスの分布 Lents: 60%
Brentwood-Darlington: 20%
Southeast Portland, Brentwood - Darlington: 20%
人間開発指数(HDI)
平均余命、教育、および一人当たり収入の統計的複合指数。Sources: [Link] Kummu, M., Taka, M. & Guillaume, J. Gridded global datasets for Gross Domestic Product and Human Development Index over 1990–2015. Sci Data 5, 180004 (2018) doi:10.1038/sdata.2018.4
Lents、 オレゴン州の二酸化炭素排出量
1人あたりの二酸化炭素(CO2)排出量(年間トン)| 場所 | CO2排出量 | 一人当たりのCO2排出量 | CO2排出強度 |
|---|---|---|---|
| Lents、 オレゴン州 | 309,809 s/t | 14.4 s/t | 86,881 米トン/mi² |
| ポートランド | 9,740,753 s/t | 16 s/t | 67,133 米トン/mi² |
| オレゴン州 | 70,678,562 s/t | 17.6 s/t | 718.4 米トン/mi² |
| アメリカ | 5,664,619,809 s/t | 17.6 s/t | 1,491 米トン/mi² |
Lents、 オレゴン州の二酸化炭素排出量
| 2013年の二酸化炭素排出量 (トン/年) | 309,809 s/t |
| 2013の人口1人あたりの二酸化炭素排出量 (トン/年) | 14.4 s/t |
| 2013年の二酸化炭素排出量 (トン/mi²/年) |
自然災害リスク
10のうちの相対リスク| 地すべり | 中 (6) |
| 干ばつ | 低 (2) |
| 地震 | 中 (6) |
*特に洪水または地滑りに関するリスクは、地域全体に及ぶとは限りません。
Sources: 1. Dilley, M., R.S. Chen, U. Deichmann, A.L. Lerner-Lam, M. Arnold, J. Agwe, P. Buys, O. Kjekstad, B. Lyon, and G. Yetman. 2005. Natural Disaster Hotspots: A Global Risk Analysis. Washington, D.C.: World Bank. https://doi.org/10.1596/0-8213-5930-4.
2. Center for Hazards and Risk Research - CHRR - Columbia University, Center for International Earth Science Information Network - CIESIN - Columbia University. 2005. Global Earthquake Hazard Distribution - Peak Ground Acceleration. Palisades, NY: NASA Socioeconomic Data and Applications Center (SEDAC). https://doi.org/10.7927/H4BZ63ZS.
3. Center for Hazards and Risk Research - CHRR - Columbia University, Center for International Earth Science Information Network - CIESIN - Columbia University, and Norwegian Geotechnical Institute - NGI. 2005. Global Landslide Hazard Distribution. Palisades, NY: NASA Socioeconomic Data and Applications Center (SEDAC). https://doi.org/10.7927/H4P848VZ.
4. Center for Hazards and Risk Research - CHRR - Columbia University, Center for International Earth Science Information Network - CIESIN - Columbia University, and International Research Institute for Climate and Society - IRI - Columbia University. 2005. Global Drought Hazard Frequency and Distribution. Palisades, NY: NASA Socioeconomic Data and Applications Center (SEDAC). https://doi.org/10.7927/H4VX0DFT.
最近の近くの地震
マグニチュード3.0以上| 日付 | 時間 | 大きさ | 距離 | 深さ | 場所 | リンク |
|---|---|---|---|---|---|---|
| 2018/04/14 | 20:45 | 3.08 | 61.2 km | 18,380 m | 6km SSE of Silverton, Oregon | usgs.gov |
| 2017/12/13 | 17:24 | 3.96 | 49.5 km | 17,370 m | 12km S of Molalla, Oregon | usgs.gov |
| 2016/10/03 | 21:29 | 3.03 | 44.3 km | 23,700 m | 4km WNW of Woodburn, Oregon | usgs.gov |
| 2016/07/16 | 18:16 | 3.03 | 19.2 km | 26,650 m | 1km SSW of Beaverton, Oregon | usgs.gov |
| 2014/04/06 | 20:33 | 3.32 | 27.9 km | 19,387 m | 6km NW of Sherwood, Oregon | usgs.gov |
| 2013/01/30 | 17:03 | 3.66 | 50.4 km | 6,447 m | 3km ENE of Amboy, Washington | usgs.gov |
| 2012/11/19 | 6:15 | 3.16 | 23.5 km | 19,797 m | Portland urban area, Oregon | usgs.gov |
| 2012/09/07 | 21:57 | 3.54 | 41.1 km | 23,810 m | Oregon | usgs.gov |
| 2007/09/23 | 23:20 | 3.6 | 55.4 km | 23,430 m | Oregon | usgs.gov |
| 2007/07/11 | 20:53 | 3.2 | 26.4 km | 23,266 m | Oregon | usgs.gov |
Lents、 オレゴン州付近で発生した過去の地震の検索
最も早い日付 最新の日付
マグニチュード3.0以上 マグニチュード4.0以上 マグニチュード5.0以上

データについて
このページのデータは、公開されている多くのツールとリソースを使用して推定されています。保証なしで提供され、不正確な内容が含まれている可能性があります。自己責任。詳細については、 こちらをご覧ください。