- 世界
- »
- US
- »
- アイオワ州
- »
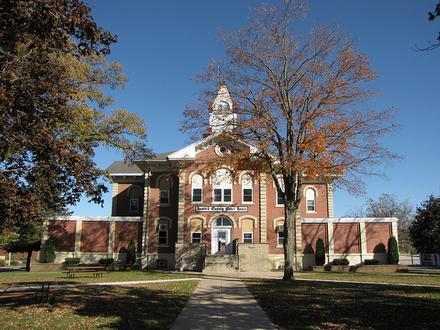
- Lime Springs、 アイオワ州
Lime Springsのビジネス
産業
産業別事業分布 産業: 18.1%
レストラン: 10.6%
ショッピング: 9%
ホームサービス: 9%
自動車: 6.5%
食品: 6%
スポーツとアクティビティ: 6%
専門家のサービス: 5.5%
医療: 5%
宗教: 4.5%
金融サービス: 4.5%
その他: 15.1%
| Lime Springs、 アイオワ州の面積 | 1.019 mi² |
| 人口 | 491 |
| 男性人口 | 242 (49.4%) |
| 女性人口 | 249 (50.6%) |
| 1975から2015にかけての人口の変動 | +26.5% |
| 2000から2015にかけての人口の変動 | -7.2% |
| 平均年齢 | 45.4 |
| 男性平均年齢 | 44.7 |
| 女性の平均年齢 | 46 |
| 市外局番 | 563, 641 |
| 現地時間 | 日曜日 7:32 |
| 時間帯 | アメリカ中部夏時間 |
| 緯度と経度 | 43.44886° / -92.28073° |
| 郵便番号 | 52155 |
Lime Springs、 アイオワ州 - 地図
Lime Springs、 アイオワ州の人口
1975年から2015年まで| データ | 1975 | 1990 | 2000 | 2015 |
|---|---|---|---|---|
| 人口 | 388 | 474 | 529 | 491 |
| 人口密度 | 380.6 / mi² | 465.0 / mi² | 519.0 / mi² | 481.7 / mi² |
2000から2015にかけてのLime Springsの人口変動
2000年から2015年にかけての7.2%の低下| 場所 | 1975以来の変化 | 1990以来の変化 | 2000以来の変化 |
|---|---|---|---|
| Lime Springs、 アイオワ州 | +26.5% | +3.6% | -7.2% |
| アイオワ州 | +21% | +11.9% | +5% |
| アメリカ | +46.9% | +27.2% | +13.7% |
Lime Springs、 アイオワ州の年齢中央値
年齢中央値:45.4 年| 場所 | 平均年齢 | 年齢の中央値(女性) | 年齢の中央値(男性) |
|---|---|---|---|
| Lime Springs、 アイオワ州 | 45.4 年 | 46 年 | 44.7 年 |
| アイオワ州 | 38.2 年 | 39.6 年 | 36.7 年 |
| アメリカ | 37.4 年 | 38.7 年 | 36.1 年 |
Lime Springs、 アイオワ州の人口ピラミッド
年齢と性別による人口| 年齢 | 男性 | 女性 | 合計 |
|---|---|---|---|
| 5歳未満 | 15 | 11 | 26 |
| 5-9 | 22 | 19 | 41 |
| 10-14 | 13 | 16 | 29 |
| 15-19 | 13 | 12 | 26 |
| 20-24 | 9 | 11 | 20 |
| 25-29 | 11 | 12 | 24 |
| 30-34 | 16 | 17 | 34 |
| 35-39 | 13 | 11 | 25 |
| 40-44 | 9 | 12 | 22 |
| 45-49 | 14 | 12 | 27 |
| 50-54 | 24 | 27 | 51 |
| 55-59 | 14 | 20 | 35 |
| 60-64 | 13 | 9 | 23 |
| 65-69 | 14 | 8 | 22 |
| 70-74 | 7 | 12 | 20 |
| 75-79 | 14 | 11 | 26 |
| 80-84 | 10 | 12 | 23 |
| 85プラス | 10 | 15 | 25 |
Lime Springs、 アイオワ州の人口密度
人口密度:481.7 / mi²| 場所 | 人口 | エリア | 人口密度 |
|---|---|---|---|
| Lime Springs、 アイオワ州 | 491 | 1.019 mi² | 481.7 / mi² |
| アイオワ州 | 3.1 ミリオン | 56,273.1 mi² | 54.9 / mi² |
| アメリカ | 321.6 ミリオン | 3,796,761.2 mi² | 84.7 / mi² |
市外局番
Lime Springsのビジネスによって使用されている市外局番の割合 市外局番 563: 86.5%
市外局番 641: 8.1%
市外局番 507: 4.1%
その他: 1.4%
人間開発指数(HDI)
平均余命、教育、および一人当たり収入の統計的複合指数。Sources: [Link] Kummu, M., Taka, M. & Guillaume, J. Gridded global datasets for Gross Domestic Product and Human Development Index over 1990–2015. Sci Data 5, 180004 (2018) doi:10.1038/sdata.2018.4
Lime Springs、 アイオワ州の二酸化炭素排出量
1人あたりの二酸化炭素(CO2)排出量(年間トン)| 場所 | CO2排出量 | 一人当たりのCO2排出量 | CO2排出強度 |
|---|---|---|---|
| Lime Springs、 アイオワ州 | 9,447 s/t | 19.2 s/t | 9,268 米トン/mi² |
| アイオワ州 | 60,512,078 s/t | 19.6 s/t | 1,075 米トン/mi² |
| アメリカ | 5,664,619,809 s/t | 17.6 s/t | 1,491 米トン/mi² |
Lime Springs、 アイオワ州の二酸化炭素排出量
| 2013年の二酸化炭素排出量 (トン/年) | 9,447 s/t |
| 2013の人口1人あたりの二酸化炭素排出量 (トン/年) | 19.2 s/t |
| 2013年の二酸化炭素排出量 (トン/mi²/年) |
データについて
このページのデータは、公開されている多くのツールとリソースを使用して推定されています。保証なしで提供され、不正確な内容が含まれている可能性があります。自己責任。詳細については、 こちらをご覧ください。