- 世界
- »
- US
- »
- オレゴン州
- »
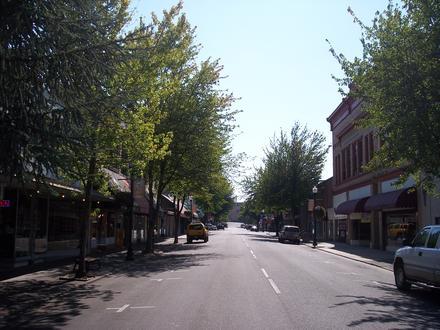
- Myrtle Creek、 オレゴン州
Myrtle Creekのビジネス
産業
産業別事業分布 ショッピング: 18.3%
ホームサービス: 11.7%
産業: 10%
レストラン: 7.3%
食品: 6.2%
自動車: 6%
医療: 5.4%
金融サービス: 5.3%
その他: 29.8%
| 業界の説明 | 事業所数 | ビジネスの平均年齢 | Googleの平均評価 | 住民1,000人あたりのビジネス |
|---|---|---|---|---|
| ガソリンスタンド | 5 | 4.2 | 1.4 | |
| ブレーキ・マフラー・変速機の修理 | 5 | 60.1 年 | 4.2 | 1.4 |
| 自動車部品 | 6 | 64.3 年 | 4.4 | 1.7 |
| 車の修理 | 17 | 49.4 年 | 4.3 | 4.9 |
| ヘアサロン | 8 | 33.7 年 | 4.6 | 2.3 |
| 美容院 | 9 | 23.7 年 | 4.6 | 2.6 |
| 行政 | 9 | 61.6 年 | 4.6 | 2.6 |
| クリエイティブアート | 5 | 24.9 年 | 4.6 | 1.4 |
| ATM | 16 | 45.5 年 | 3.6 | 4.6 |
| ローン会社 | 9 | 53.9 年 | 4.0 | 2.6 |
| 銀行 | 14 | 45.5 年 | 3.6 | 4.0 |
| コンビニエンスストア | 8 | 34 年 | 4.5 | 2.3 |
| 食料雑貨品店・スーパーマーケット | 19 | 26.3 年 | 4.0 | 5.5 |
| その他の建設 | 7 | 22.8 年 | 4.4 | 2.0 |
| ゼネコン | 21 | 29 年 | 4.6 | 6.1 |
| 不動産 | 18 | 34.6 年 | 3.8 | 5.2 |
| 林業・伐採 | 5 | 37.9 年 | 1.4 | |
| 配管設置・修理 | 5 | 4.9 | 1.4 | |
| 電気設備 | 5 | 18.7 年 | 3.8 | 1.4 |
| その他の宿泊施設 | 6 | 34.7 年 | 3.8 | 1.7 |
| 建物の建設 | 12 | 36.6 年 | 4.5 | 3.5 |
| 建設資材の卸売 | 5 | 29.3 年 | 1.4 | |
| 教会 | 16 | 55.3 年 | 4.4 | 4.6 |
| アメリカ料理レストラン | 5 | 4.5 | 1.4 | |
| ショッピングその他 | 14 | 31.4 年 | 3.8 | 4.0 |
| 家電製品・グッズ | 8 | 32.5 年 | 4.3 | 2.3 |
| 公共公園 | 6 | 4.4 | 1.7 |
| Myrtle Creek、 オレゴン州の面積 | 2.51 mi² |
| 人口 | 3468 |
| 男性人口 | 1729 (49.9%) |
| 女性人口 | 1739 (50.1%) |
| 1975から2015にかけての人口の変動 | +93.4% |
| 2000から2015にかけての人口の変動 | +9.4% |
| 平均年齢 | 39.3 |
| 男性平均年齢 | 38.2 |
| 女性の平均年齢 | 40.4 |
| 市外局番 | 541 |
| 地域 | Myrtle Creek |
| 現地時間 | 土曜日 22:07 |
| 時間帯 | アメリカ太平洋夏時間 |
| 緯度と経度 | 43.02012° / -123.29312° |
| 郵便番号 | 97457 |
Myrtle Creek、 オレゴン州 - 地図
Myrtle Creek、 オレゴン州の人口
1975年から2015年まで| データ | 1975 | 1990 | 2000 | 2015 |
|---|---|---|---|---|
| 人口 | 1793 | 2399 | 3170 | 3468 |
| 人口密度 | 714.4 / mi² | 955.9 / mi² | 1263 / mi² | 1381 / mi² |
2000から2015にかけてのMyrtle Creekの人口変動
2000年から2015年にかけての9.4%の増加| 場所 | 1975以来の変化 | 1990以来の変化 | 2000以来の変化 |
|---|---|---|---|
| Myrtle Creek、 オレゴン州 | +93.4% | +44.6% | +9.4% |
| オレゴン州 | +65% | +34.6% | +16.8% |
| アメリカ | +46.9% | +27.2% | +13.7% |
Myrtle Creek、 オレゴン州の年齢中央値
年齢中央値:39.3 年| 場所 | 平均年齢 | 年齢の中央値(女性) | 年齢の中央値(男性) |
|---|---|---|---|
| Myrtle Creek、 オレゴン州 | 39.3 年 | 40.4 年 | 38.2 年 |
| オレゴン州 | 38.5 年 | 39.6 年 | 37.3 年 |
| アメリカ | 37.4 年 | 38.7 年 | 36.1 年 |
Myrtle Creek、 オレゴン州の人口ピラミッド
年齢と性別による人口| 年齢 | 男性 | 女性 | 合計 |
|---|---|---|---|
| 5歳未満 | 121 | 105 | 226 |
| 5-9 | 112 | 120 | 233 |
| 10-14 | 118 | 102 | 221 |
| 15-19 | 135 | 107 | 243 |
| 20-24 | 111 | 96 | 208 |
| 25-29 | 104 | 112 | 217 |
| 30-34 | 101 | 116 | 218 |
| 35-39 | 96 | 103 | 199 |
| 40-44 | 111 | 119 | 231 |
| 45-49 | 111 | 127 | 238 |
| 50-54 | 136 | 119 | 256 |
| 55-59 | 133 | 106 | 240 |
| 60-64 | 85 | 119 | 204 |
| 65-69 | 92 | 94 | 186 |
| 70-74 | 66 | 77 | 144 |
| 75-79 | 39 | 49 | 88 |
| 80-84 | 39 | 37 | 76 |
| 85プラス | 18 | 31 | 49 |
Myrtle Creek、 オレゴン州の人口密度
人口密度:1381 / mi²| 場所 | 人口 | エリア | 人口密度 |
|---|---|---|---|
| Myrtle Creek、 オレゴン州 | 3468 | 2.51 mi² | 1381 / mi² |
| オレゴン州 | 4.0 ミリオン | 98,379.3 mi² | 40.8 / mi² |
| アメリカ | 321.6 ミリオン | 3,796,761.2 mi² | 84.7 / mi² |
Myrtle Creek、 オレゴン州の過去および将来の予測人口
1870から2100にかけての推定人口Sources:
1. JRC (European Commission's Joint Research Centre) work on the GHS built-up grid
2. CIESIN (Center for International Earth Science Information Network)
3. [リンク] Klein Goldewijk, K., Beusen, A., Doelman, J., and Stehfest, E.: Anthropogenic land use estimates for the Holocene – HYDE 3.2, Earth Syst. Sci. Data, 9, 927–953, https://doi.org/10.5194/essd-9-927-2017, 2017.
Myrtle Creek、 オレゴン州の価格によるビジネスの分布
安価な: 52.1%
適度な: 45.8%
高価な: 2.1%
人間開発指数(HDI)
平均余命、教育、および一人当たり収入の統計的複合指数。Sources: [Link] Kummu, M., Taka, M. & Guillaume, J. Gridded global datasets for Gross Domestic Product and Human Development Index over 1990–2015. Sci Data 5, 180004 (2018) doi:10.1038/sdata.2018.4
Myrtle Creek、 オレゴン州の二酸化炭素排出量
1人あたりの二酸化炭素(CO2)排出量(年間トン)| 場所 | CO2排出量 | 一人当たりのCO2排出量 | CO2排出強度 |
|---|---|---|---|
| Myrtle Creek、 オレゴン州 | 56,294 s/t | 16.2 s/t | 22,431 米トン/mi² |
| オレゴン州 | 70,678,562 s/t | 17.6 s/t | 718.4 米トン/mi² |
| アメリカ | 5,664,619,809 s/t | 17.6 s/t | 1,491 米トン/mi² |
Myrtle Creek、 オレゴン州の二酸化炭素排出量
| 2013年の二酸化炭素排出量 (トン/年) | 56,294 s/t |
| 2013の人口1人あたりの二酸化炭素排出量 (トン/年) | 16.2 s/t |
| 2013年の二酸化炭素排出量 (トン/mi²/年) |
自然災害リスク
10のうちの相対リスク| 地すべり | 中 (6) |
| 干ばつ | 低 (2) |
| 地震 | 中 (6) |
*特に洪水または地滑りに関するリスクは、地域全体に及ぶとは限りません。
Sources: 1. Dilley, M., R.S. Chen, U. Deichmann, A.L. Lerner-Lam, M. Arnold, J. Agwe, P. Buys, O. Kjekstad, B. Lyon, and G. Yetman. 2005. Natural Disaster Hotspots: A Global Risk Analysis. Washington, D.C.: World Bank. https://doi.org/10.1596/0-8213-5930-4.
2. Center for Hazards and Risk Research - CHRR - Columbia University, Center for International Earth Science Information Network - CIESIN - Columbia University. 2005. Global Earthquake Hazard Distribution - Peak Ground Acceleration. Palisades, NY: NASA Socioeconomic Data and Applications Center (SEDAC). https://doi.org/10.7927/H4BZ63ZS.
3. Center for Hazards and Risk Research - CHRR - Columbia University, Center for International Earth Science Information Network - CIESIN - Columbia University, and Norwegian Geotechnical Institute - NGI. 2005. Global Landslide Hazard Distribution. Palisades, NY: NASA Socioeconomic Data and Applications Center (SEDAC). https://doi.org/10.7927/H4P848VZ.
4. Center for Hazards and Risk Research - CHRR - Columbia University, Center for International Earth Science Information Network - CIESIN - Columbia University, and International Research Institute for Climate and Society - IRI - Columbia University. 2005. Global Drought Hazard Frequency and Distribution. Palisades, NY: NASA Socioeconomic Data and Applications Center (SEDAC). https://doi.org/10.7927/H4VX0DFT.
最近の近くの地震
マグニチュード3.0以上| 日付 | 時間 | 大きさ | 距離 | 深さ | 場所 | リンク |
|---|---|---|---|---|---|---|
| 2016/12/04 | 22:42 | 3.3 | 97.4 km | 15,790 m | 14km SW of Barview, Oregon | usgs.gov |
| 2014/01/24 | 5:53 | 3.83 | 70.7 km | 4,300 m | 44km ENE of Gold Beach, Oregon | usgs.gov |
| 2013/03/24 | 4:39 | 3.1 | 85.3 km | 14,394 m | 33km E of Shady Cove, Oregon | usgs.gov |
| 2010/07/03 | 15:25 | 3.45 | 94.4 km | 34,306 m | Oregon | usgs.gov |
| 2009/02/26 | 1:52 | 4.24 | 72.5 km | 36,796 m | Oregon | usgs.gov |
| 1961/08/23 | 10:59 | 4.6 | 69.3 km | None | Oregon | usgs.gov |
データについて
このページのデータは、公開されている多くのツールとリソースを使用して推定されています。保証なしで提供され、不正確な内容が含まれている可能性があります。自己責任。詳細については、 こちらをご覧ください。