- 世界
- »
- US
- »
- ウィスコンシン州
- »
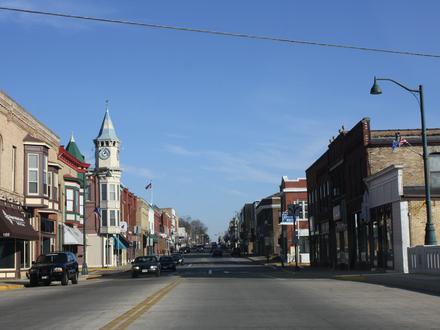
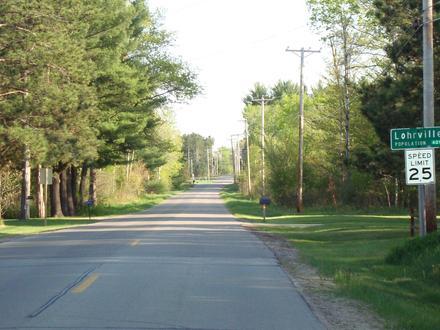
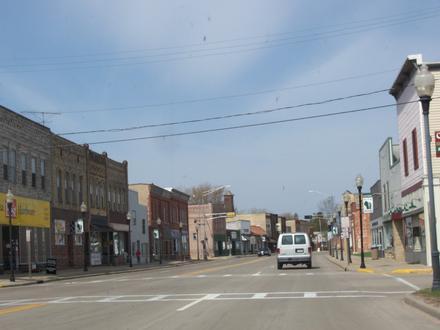
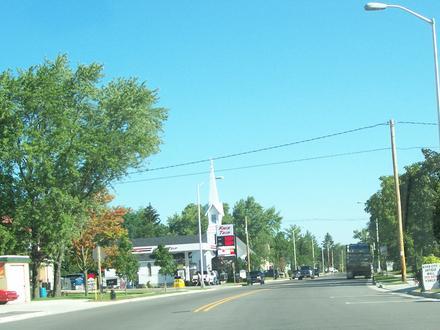
- Redgranite、 ウィスコンシン州
Redgraniteのビジネス
産業
産業別事業分布 ショッピング: 13.6%
自動車: 13%
ホームサービス: 11%
産業: 10.7%
レストラン: 8.8%
医療: 6.8%
地域のサービス: 5.8%
自治体: 5.5%
その他: 24.7%
| 業界の説明 | 事業所数 | ビジネスの平均年齢 | Googleの平均評価 | 住民1,000人あたりのビジネス |
|---|---|---|---|---|
| 行政 | 7 | 4.0 | 3.2 | |
| ゼネコン | 9 | 37.5 年 | 4.5 | 4.1 |
| Redgranite、 ウィスコンシン州の面積 | 2.29 mi² |
| 人口 | 2194 |
| 男性人口 | 1625 (74.1%) |
| 女性人口 | 569 (25.9%) |
| 1975から2015にかけての人口の変動 | +11% |
| 2000から2015にかけての人口の変動 | +7.9% |
| 平均年齢 | 38.9 |
| 男性平均年齢 | 38 |
| 女性の平均年齢 | 41.3 |
| 市外局番 | 920 |
| 現地時間 | 日曜日 1:42 |
| 時間帯 | アメリカ中部夏時間 |
| 緯度と経度 | 44.04192° / -89.09845° |
| 郵便番号 | 54970 |
Redgranite、 ウィスコンシン州 - 地図
Redgranite、 ウィスコンシン州の人口
1975年から2015年まで| データ | 1975 | 1990 | 2000 | 2015 |
|---|---|---|---|---|
| 人口 | 1977 | 2020 | 2033 | 2194 |
| 人口密度 | 863.5 / mi² | 882.3 / mi² | 887.9 / mi² | 958.2 / mi² |
2000から2015にかけてのRedgraniteの人口変動
2000年から2015年にかけての7.9%の増加| 場所 | 1975以来の変化 | 1990以来の変化 | 2000以来の変化 |
|---|---|---|---|
| Redgranite、 ウィスコンシン州 | +11% | +8.6% | +7.9% |
| ウィスコンシン州 | +32.7% | +17.5% | +7.6% |
| アメリカ | +46.9% | +27.2% | +13.7% |
Redgranite、 ウィスコンシン州の年齢中央値
年齢中央値:38.9 年| 場所 | 平均年齢 | 年齢の中央値(女性) | 年齢の中央値(男性) |
|---|---|---|---|
| Redgranite、 ウィスコンシン州 | 38.9 年 | 41.3 年 | 38 年 |
| ウィスコンシン州 | 38.9 年 | 40 年 | 37.7 年 |
| アメリカ | 37.4 年 | 38.7 年 | 36.1 年 |
Redgranite、 ウィスコンシン州の人口ピラミッド
年齢と性別による人口| 年齢 | 男性 | 女性 | 合計 |
|---|---|---|---|
| 5歳未満 | 35 | 40 | 75 |
| 5-9 | 38 | 37 | 75 |
| 10-14 | 32 | 32 | 64 |
| 15-19 | 46 | 36 | 82 |
| 20-24 | 136 | 33 | 169 |
| 25-29 | 208 | 40 | 249 |
| 30-34 | 199 | 30 | 229 |
| 35-39 | 198 | 31 | 230 |
| 40-44 | 198 | 24 | 223 |
| 45-49 | 157 | 45 | 202 |
| 50-54 | 133 | 29 | 162 |
| 55-59 | 75 | 37 | 112 |
| 60-64 | 65 | 30 | 95 |
| 65-69 | 37 | 28 | 65 |
| 70-74 | 33 | 20 | 53 |
| 75-79 | 16 | 26 | 43 |
| 80-84 | 10 | 17 | 28 |
| 85プラス | 10 | 36 | 46 |
Redgranite、 ウィスコンシン州の人口密度
人口密度:958.2 / mi²| 場所 | 人口 | エリア | 人口密度 |
|---|---|---|---|
| Redgranite、 ウィスコンシン州 | 2194 | 2.29 mi² | 958.2 / mi² |
| ウィスコンシン州 | 5.8 ミリオン | 65,496.7 mi² | 88.5 / mi² |
| アメリカ | 321.6 ミリオン | 3,796,761.2 mi² | 84.7 / mi² |
Redgranite、 ウィスコンシン州の過去および将来の予測人口
1850から2100にかけての推定人口Sources:
1. JRC (European Commission's Joint Research Centre) work on the GHS built-up grid
2. CIESIN (Center for International Earth Science Information Network)
3. [リンク] Klein Goldewijk, K., Beusen, A., Doelman, J., and Stehfest, E.: Anthropogenic land use estimates for the Holocene – HYDE 3.2, Earth Syst. Sci. Data, 9, 927–953, https://doi.org/10.5194/essd-9-927-2017, 2017.
Redgranite、 ウィスコンシン州の価格によるビジネスの分布
安価な: 76.5%
適度な: 17.6%
高価な: 5.9%
人間開発指数(HDI)
平均余命、教育、および一人当たり収入の統計的複合指数。Sources: [Link] Kummu, M., Taka, M. & Guillaume, J. Gridded global datasets for Gross Domestic Product and Human Development Index over 1990–2015. Sci Data 5, 180004 (2018) doi:10.1038/sdata.2018.4
Redgranite、 ウィスコンシン州の二酸化炭素排出量
1人あたりの二酸化炭素(CO2)排出量(年間トン)| 場所 | CO2排出量 | 一人当たりのCO2排出量 | CO2排出強度 |
|---|---|---|---|
| Redgranite、 ウィスコンシン州 | 49,090 s/t | 22.4 s/t | 21,440 米トン/mi² |
| ウィスコンシン州 | 122,230,616 s/t | 21.1 s/t | 1,866 米トン/mi² |
| アメリカ | 5,664,619,809 s/t | 17.6 s/t | 1,491 米トン/mi² |
Redgranite、 ウィスコンシン州の二酸化炭素排出量
| 2013年の二酸化炭素排出量 (トン/年) | 49,090 s/t |
| 2013の人口1人あたりの二酸化炭素排出量 (トン/年) | 22.4 s/t |
| 2013年の二酸化炭素排出量 (トン/mi²/年) |
データについて
このページのデータは、公開されている多くのツールとリソースを使用して推定されています。保証なしで提供され、不正確な内容が含まれている可能性があります。自己責任。詳細については、 こちらをご覧ください。