- 世界
- »
- US
- »
- イリノイ州
- »
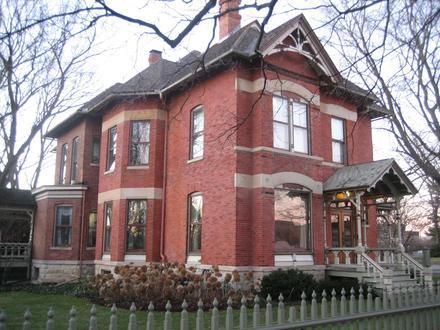
- Sycamore、 イリノイ州
Sycamoreのビジネス

産業
産業別事業分布 医療: 18.3%
ショッピング: 12.8%
専門家のサービス: 11.6%
産業: 8.5%
ホームサービス: 7.5%
自動車: 5.9%
レストラン: 5.8%
金融サービス: 5.3%
その他: 24.3%
| 業界の説明 | 事業所数 | ビジネスの平均年齢 | Googleの平均評価 | 住民1,000人あたりのビジネス |
|---|---|---|---|---|
| 新車ディーラー | 20 | 43.3 年 | 4.2 | 1.1 |
| 自動車部品 | 23 | 42.9 年 | 4.1 | 1.2 |
| 車の修理 | 54 | 34.2 年 | 4.2 | 2.9 |
| ヘアサロン | 30 | 25.1 年 | 4.1 | 1.6 |
| 美容院 | 34 | 25 年 | 4.4 | 1.8 |
| 社会福祉 | 32 | 27.6 年 | 3.3 | 1.7 |
| 行政 | 53 | 33.1 年 | 3.7 | 2.8 |
| ATM | 21 | 57.4 年 | 3.6 | 1.1 |
| ローン会社 | 51 | 48.3 年 | 4.6 | 2.7 |
| 金融その他 | 21 | 58.8 年 | 3.8 | 1.1 |
| 銀行 | 23 | 43.9 年 | 3.7 | 1.2 |
| 食料雑貨品店・スーパーマーケット | 26 | 36.6 年 | 4.4 | 1.4 |
| その他の建設 | 34 | 42.5 年 | 4.2 | 1.8 |
| ゼネコン | 59 | 39.1 年 | 4.3 | 3.2 |
| 不動産 | 61 | 29.8 年 | 4.3 | 3.3 |
| 造園 | 21 | 27.7 年 | 4.5 | 1.1 |
| その他の会員組織 | 19 | 47.2 年 | 4.5 | 1.0 |
| 建物の建設 | 38 | 34.4 年 | 3.9 | 2.0 |
| カイロプラクティック | 27 | 32.7 年 | 4.9 | 1.4 |
| 保健医療 | 317 | 28 年 | 4.2 | 17.0 |
| 内科医と外科医 | 90 | 27.3 年 | 3.8 | 4.8 |
| 歯医者 | 39 | 31.8 年 | 4.7 | 2.1 |
| 理学療法 | 19 | 23.9 年 | 4.7 | 1.0 |
| 企業マネジメント | 28 | 26.5 年 | 4.8 | 1.5 |
| 弁護士 | 68 | 33 年 | 4.0 | 3.7 |
| 特殊デザイン | 20 | 21.5 年 | 4.8 | 1.1 |
| 科学・技術サービス | 20 | 27.8 年 | 4.8 | 1.1 |
| 経理 | 18 | 33.1 年 | 5.0 | 1.0 |
| 教会 | 29 | 66.7 年 | 4.7 | 1.6 |
| ショッピングその他 | 35 | 37.6 年 | 4.4 | 1.9 |
| 薬局・ドラッグストア | 22 | 49.4 年 | 4.5 | 1.2 |
| Sycamore、 イリノイ州の面積 | 9.76 mi² |
| 人口 | 18626 |
| 男性人口 | 9136 (49%) |
| 女性人口 | 9490 (51%) |
| 1975から2015にかけての人口の変動 | +37.3% |
| 2000から2015にかけての人口の変動 | +26.8% |
| 平均年齢 | 35.1 |
| 男性平均年齢 | 33.9 |
| 女性の平均年齢 | 36.2 |
| 市外局番 | 708, 815, 847 |
| 地域 | Bethany Park, Electric Park Gardens, Fairlands, Foxpointe Condominiums, Heron Creek, Heron Creek Estates North, Meadow Creek, Oaklands, Sycamore, Woodgate of Sycamore |
| 現地時間 | 月曜日 6:55 |
| 時間帯 | アメリカ中部夏時間 |
| 緯度と経度 | 41.98892° / -88.68675° |
Sycamore、 イリノイ州 - 地図
Sycamore、 イリノイ州の人口
1975年から2015年まで| データ | 1975 | 1990 | 2000 | 2015 |
|---|---|---|---|---|
| 人口 | 13569 | 14468 | 14692 | 18626 |
| 人口密度 | 1389 / mi² | 1481 / mi² | 1504 / mi² | 1907 / mi² |
2000から2015にかけてのSycamoreの人口変動
2000年から2015年にかけての26.8%の増加| 場所 | 1975以来の変化 | 1990以来の変化 | 2000以来の変化 |
|---|---|---|---|
| Sycamore、 イリノイ州 | +37.3% | +28.7% | +26.8% |
| イリノイ州 | +16.7% | +9.7% | +3.9% |
| アメリカ | +46.9% | +27.2% | +13.7% |
Sycamore、 イリノイ州の年齢中央値
年齢中央値:35.1 年| 場所 | 平均年齢 | 年齢の中央値(女性) | 年齢の中央値(男性) |
|---|---|---|---|
| Sycamore、 イリノイ州 | 35.1 年 | 36.2 年 | 33.9 年 |
| イリノイ州 | 36.6 年 | 37.9 年 | 35.3 年 |
| アメリカ | 37.4 年 | 38.7 年 | 36.1 年 |
Sycamore、 イリノイ州の人口ピラミッド
年齢と性別による人口| 年齢 | 男性 | 女性 | 合計 |
|---|---|---|---|
| 5歳未満 | 609 | 636 | 1245 |
| 5-9 | 738 | 682 | 1421 |
| 10-14 | 691 | 642 | 1333 |
| 15-19 | 648 | 568 | 1216 |
| 20-24 | 560 | 555 | 1115 |
| 25-29 | 789 | 786 | 1576 |
| 30-34 | 675 | 722 | 1397 |
| 35-39 | 675 | 668 | 1344 |
| 40-44 | 608 | 619 | 1227 |
| 45-49 | 684 | 716 | 1400 |
| 50-54 | 637 | 680 | 1318 |
| 55-59 | 532 | 586 | 1118 |
| 60-64 | 423 | 480 | 904 |
| 65-69 | 306 | 329 | 636 |
| 70-74 | 205 | 251 | 457 |
| 75-79 | 155 | 222 | 377 |
| 80-84 | 116 | 172 | 288 |
| 85プラス | 85 | 178 | 264 |
Sycamore、 イリノイ州の人口密度
人口密度:1907 / mi²| 場所 | 人口 | エリア | 人口密度 |
|---|---|---|---|
| Sycamore、 イリノイ州 | 18626 | 9.76 mi² | 1907 / mi² |
| イリノイ州 | 13.0 ミリオン | 57,913.8 mi² | 224.0 / mi² |
| アメリカ | 321.6 ミリオン | 3,796,761.2 mi² | 84.7 / mi² |
Sycamore、 イリノイ州の予測人口
1975から2100にかけての推定人口Sources:
1. JRC (European Commission's Joint Research Centre) work on the GHS built-up grid
2. CIESIN (Center for International Earth Science Information Network)
3. [リンク] Klein Goldewijk, K., Beusen, A., Doelman, J., and Stehfest, E.: Anthropogenic land use estimates for the Holocene – HYDE 3.2, Earth Syst. Sci. Data, 9, 927–953, https://doi.org/10.5194/essd-9-927-2017, 2017.
地域
Sycamoreの地区別のビジネスの分布 Meadow Creek: 14.1%
Sycamore: 12.3%
Bethany Park: 10.9%
Oaklands: 9.9%
Electric Park Gardens: 6.7%
Woodgate of Sycamore: 6%
その他: 40.1%
Sycamore、 イリノイ州の価格によるビジネスの分布
適度な: 48.5%
安価な: 40%
高価な: 10.3%
非常に高価な: 1.2%
人間開発指数(HDI)
平均余命、教育、および一人当たり収入の統計的複合指数。Sources: [Link] Kummu, M., Taka, M. & Guillaume, J. Gridded global datasets for Gross Domestic Product and Human Development Index over 1990–2015. Sci Data 5, 180004 (2018) doi:10.1038/sdata.2018.4
Sycamore、 イリノイ州の二酸化炭素排出量
1人あたりの二酸化炭素(CO2)排出量(年間トン)| 場所 | CO2排出量 | 一人当たりのCO2排出量 | CO2排出強度 |
|---|---|---|---|
| Sycamore、 イリノイ州 | 364,569 s/t | 19.6 s/t | 37,337 米トン/mi² |
| イリノイ州 | 259,471,378 s/t | 20 s/t | 4,480 米トン/mi² |
| アメリカ | 5,664,619,809 s/t | 17.6 s/t | 1,491 米トン/mi² |
Sycamore、 イリノイ州の二酸化炭素排出量
| 2013年の二酸化炭素排出量 (トン/年) | 364,569 s/t |
| 2013の人口1人あたりの二酸化炭素排出量 (トン/年) | 19.6 s/t |
| 2013年の二酸化炭素排出量 (トン/mi²/年) |
自然災害リスク
10のうちの相対リスク| 洪水 | 高 (9) |
*特に洪水または地滑りに関するリスクは、地域全体に及ぶとは限りません。
Sources: 1. Dilley, M., R.S. Chen, U. Deichmann, A.L. Lerner-Lam, M. Arnold, J. Agwe, P. Buys, O. Kjekstad, B. Lyon, and G. Yetman. 2005. Natural Disaster Hotspots: A Global Risk Analysis. Washington, D.C.: World Bank. https://doi.org/10.1596/0-8213-5930-4.
2. Center for Hazards and Risk Research - CHRR - Columbia University, Center for International Earth Science Information Network - CIESIN - Columbia University. 2005. Global Flood Hazard Frequency and Distribution. Palisades, NY: NASA Socioeconomic Data and Applications Center (SEDAC). https://doi.org/10.7927/H4668B3D.
最近の近くの地震
マグニチュード3.0以上| 日付 | 時間 | 大きさ | 距離 | 深さ | 場所 | リンク |
|---|---|---|---|---|---|---|
| 2013/11/04 | 10:35 | 3.2 | 74.6 km | 1,000 m | 1km NW of Summit, Illinois | usgs.gov |
| 2010/02/10 | 1:59 | 3.8 | 15.8 km | 10,000 m | 8km NW of Village of Campton Hills, Illinois | usgs.gov |
| 2004/06/27 | 23:10 | 4.2 | 61.4 km | 10,000 m | 10km NW of Ottawa, Illinois | usgs.gov |
| 1999/09/02 | 9:17 | 3.5 | 68.7 km | 5,000 m | Illinois | usgs.gov |
| 1972/09/14 | 22:22 | 4.04 | 68.4 km | 11,000 m | Illinois | usgs.gov |
| 1912/01/02 | 8:21 | 4.5 | 56.5 km | None | Illinois | usgs.gov |
| 1909/05/26 | 6:42 | 5.1 | 65.1 km | None | Illinois | usgs.gov |
| 1881/05/26 | 16:07 | 4.6 | 83.9 km | None | Illinois | usgs.gov |
| 1804/08/20 | 12:17 | 4.4 | 73.5 km | None | Illinois | usgs.gov |
データについて
このページのデータは、公開されている多くのツールとリソースを使用して推定されています。保証なしで提供され、不正確な内容が含まれている可能性があります。自己責任。詳細については、 こちらをご覧ください。