- 世界
- »
- US
- »
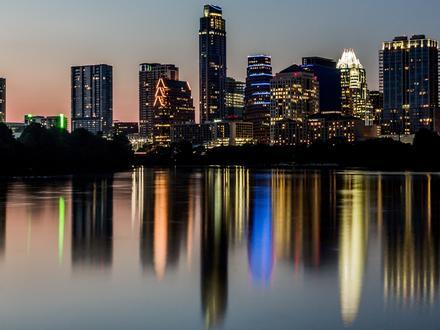
- テキサス州
- »
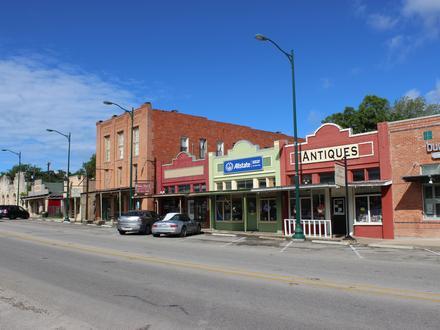
- Del Valle、 テキサス州
Del Valleのビジネス
産業
産業別事業分布 ホームサービス: 16.5%
産業: 12.6%
ショッピング: 12.4%
自動車: 12%
レストラン: 8.7%
専門家のサービス: 8.1%
その他: 29.6%
| 業界の説明 | 事業所数 | ビジネスの平均年齢 | Googleの平均評価 | 住民1,000人あたりのビジネス |
|---|---|---|---|---|
| ガソリンスタンド | 16 | 22.7 年 | 3.7 | 1.8 |
| トラック・トレーラーのレンタル | 6 | 3.0 | 0.7 | |
| 中古車販売業者 | 8 | 24.9 年 | 4.5 | 0.9 |
| 新車ディーラー | 13 | 24.3 年 | 4.5 | 1.4 |
| 自動車部品 | 13 | 24.9 年 | 4.5 | 1.4 |
| 車の修理 | 23 | 27.8 年 | 4.5 | 2.5 |
| 車体修理 | 7 | 27.7 年 | 4.0 | 0.8 |
| ヘアサロン | 5 | 0.6 | ||
| 美容院 | 9 | 19.3 年 | 2.9 | 1.0 |
| 行政 | 7 | 3.2 | 0.8 | |
| ATM | 9 | 5.0 | 1.0 | |
| ローン会社 | 6 | 27.9 年 | 3.8 | 0.7 |
| 銀行 | 7 | 5.0 | 0.8 | |
| コンビニエンスストア | 12 | 20 年 | 3.8 | 1.3 |
| 食料雑貨品店・スーパーマーケット | 9 | 28.8 年 | 4.3 | 1.0 |
| その他の建設 | 22 | 21.8 年 | 4.7 | 2.4 |
| ゼネコン | 38 | 26.8 年 | 4.2 | 4.2 |
| 不動産 | 15 | 35.1 年 | 3.7 | 1.7 |
| 住宅の建設 | 7 | 4.0 | 0.8 | |
| 引っ越し業者 | 10 | 32.7 年 | 4.5 | 1.1 |
| 解体・敷地造成 | 5 | 3.7 | 0.6 | |
| 造園 | 11 | 24.7 年 | 3.6 | 1.2 |
| その他の宿泊施設 | 12 | 26 年 | 3.5 | 1.3 |
| キャンピングカー駐車場 | 7 | 26.3 年 | 3.7 | 0.8 |
| 倉庫・保管 | 5 | 4.3 | 0.6 | |
| 建物の建設 | 14 | 26 年 | 3.8 | 1.5 |
| 建設資材の卸売 | 9 | 23 年 | 4.6 | 1.0 |
| 機械の卸売 | 5 | 33.7 年 | 0.6 | |
| 貨物/民間輸送 | 8 | 28.3 年 | 4.1 | 0.9 |
| その他の修理 | 6 | 0.7 | ||
| 保健医療 | 7 | 0.8 | ||
| 内科医と外科医 | 5 | 0.6 | ||
| 弁護士 | 5 | 5.0 | 0.6 | |
| 教会 | 11 | 26.2 年 | 4.6 | 1.2 |
| バー・パブ・居酒屋 | 5 | 3.3 | 0.6 | |
| メキシコ料理レストラン | 7 | 4.3 | 0.8 | |
| ラテンアメリカ料理レストラン | 5 | 4.3 | 0.6 | |
| ショッピングその他 | 17 | 34.2 年 | 4.2 | 1.9 |
| 家電製品・グッズ | 6 | 4.9 | 0.7 | |
| 賃貸機器 | 5 | 0.6 | ||
| 公共公園 | 7 | 4.5 | 0.8 |
| Del Valle、 テキサス州の面積 | 21.69 mi² |
| 人口 | 9063 |
| 男性人口 | 5327 (58.8%) |
| 女性人口 | 3736 (41.2%) |
| 1975から2015にかけての人口の変動 | +88.1% |
| 2000から2015にかけての人口の変動 | +39.3% |
| 平均年齢 | 28.7 |
| 男性平均年齢 | 29.2 |
| 女性の平均年齢 | 27.9 |
| 市外局番 | 512 |
| 地域 | Del Valle |
| 現地時間 | 日曜日 1:00 |
| 時間帯 | アメリカ中部夏時間 |
| 緯度と経度 | 30.21077° / -97.65472° |
| 郵便番号 | 78617 |
Del Valle、 テキサス州 - 地図
Del Valle、 テキサス州の人口
1975年から2015年まで| データ | 1975 | 1990 | 2000 | 2015 |
|---|---|---|---|---|
| 人口 | 4817 | 5991 | 6505 | 9063 |
| 人口密度 | 222.1 / mi² | 276.3 / mi² | 300.0 / mi² | 417.9 / mi² |
2000から2015にかけてのDel Valleの人口変動
2000年から2015年にかけての39.3%の増加| 場所 | 1975以来の変化 | 1990以来の変化 | 2000以来の変化 |
|---|---|---|---|
| Del Valle、 テキサス州 | +88.1% | +51.3% | +39.3% |
| オースティン | +85% | +53.2% | +42.3% |
| テキサス州 | +111% | +60.8% | +31.3% |
| アメリカ | +46.9% | +27.2% | +13.7% |
Del Valle、 テキサス州の年齢中央値
年齢中央値:28.7 年| 場所 | 平均年齢 | 年齢の中央値(女性) | 年齢の中央値(男性) |
|---|---|---|---|
| Del Valle、 テキサス州 | 28.7 年 | 27.9 年 | 29.2 年 |
| オースティン | 31.1 年 | 31.4 年 | 30.9 年 |
| テキサス州 | 33.8 年 | 34.8 年 | 32.8 年 |
| アメリカ | 37.4 年 | 38.7 年 | 36.1 年 |
Del Valle、 テキサス州の人口ピラミッド
年齢と性別による人口| 年齢 | 男性 | 女性 | 合計 |
|---|---|---|---|
| 5歳未満 | 368 | 382 | 751 |
| 5-9 | 340 | 391 | 732 |
| 10-14 | 357 | 321 | 678 |
| 15-19 | 461 | 295 | 756 |
| 20-24 | 606 | 279 | 885 |
| 25-29 | 630 | 345 | 976 |
| 30-34 | 555 | 334 | 889 |
| 35-39 | 479 | 314 | 793 |
| 40-44 | 405 | 252 | 658 |
| 45-49 | 379 | 225 | 604 |
| 50-54 | 311 | 202 | 514 |
| 55-59 | 186 | 143 | 330 |
| 60-64 | 99 | 81 | 180 |
| 65-69 | 69 | 62 | 131 |
| 70-74 | 35 | 46 | 81 |
| 75-79 | 20 | 30 | 51 |
| 80-84 | 18 | 20 | 39 |
| 85プラス | 9 | 14 | 24 |
Del Valle、 テキサス州の人口密度
人口密度:417.9 / mi²| 場所 | 人口 | エリア | 人口密度 |
|---|---|---|---|
| Del Valle、 テキサス州 | 9063 | 21.69 mi² | 417.9 / mi² |
| オースティン | 885347 | 305.1 mi² | 2902 / mi² |
| テキサス州 | 27.5 ミリオン | 268,597.7 mi² | 102.5 / mi² |
| アメリカ | 321.6 ミリオン | 3,796,761.2 mi² | 84.7 / mi² |
Del Valle、 テキサス州の過去および将来の予測人口
1860から2100にかけての推定人口Sources:
1. JRC (European Commission's Joint Research Centre) work on the GHS built-up grid
2. CIESIN (Center for International Earth Science Information Network)
3. [リンク] Klein Goldewijk, K., Beusen, A., Doelman, J., and Stehfest, E.: Anthropogenic land use estimates for the Holocene – HYDE 3.2, Earth Syst. Sci. Data, 9, 927–953, https://doi.org/10.5194/essd-9-927-2017, 2017.
Del Valle、 テキサス州の価格によるビジネスの分布
安価な: 59%
適度な: 35.9%
高価な: 5.1%
人間開発指数(HDI)
平均余命、教育、および一人当たり収入の統計的複合指数。Sources: [Link] Kummu, M., Taka, M. & Guillaume, J. Gridded global datasets for Gross Domestic Product and Human Development Index over 1990–2015. Sci Data 5, 180004 (2018) doi:10.1038/sdata.2018.4
Del Valle、 テキサス州の二酸化炭素排出量
1人あたりの二酸化炭素(CO2)排出量(年間トン)| 場所 | CO2排出量 | 一人当たりのCO2排出量 | CO2排出強度 |
|---|---|---|---|
| Del Valle、 テキサス州 | 119,482 s/t | 13.2 s/t | 5,509 米トン/mi² |
| オースティン | 15,968,644 s/t | 18 s/t | 52,344 米トン/mi² |
| テキサス州 | 488,896,034 s/t | 17.8 s/t | 1,820 米トン/mi² |
| アメリカ | 5,664,619,809 s/t | 17.6 s/t | 1,491 米トン/mi² |
Del Valle、 テキサス州の二酸化炭素排出量
| 2013年の二酸化炭素排出量 (トン/年) | 119,482 s/t |
| 2013の人口1人あたりの二酸化炭素排出量 (トン/年) | 13.2 s/t |
| 2013年の二酸化炭素排出量 (トン/mi²/年) |
自然災害リスク
10のうちの相対リスク| 干ばつ | 低 (2) |
| 洪水 | 高 (9) |
*特に洪水または地滑りに関するリスクは、地域全体に及ぶとは限りません。
Sources: 1. Dilley, M., R.S. Chen, U. Deichmann, A.L. Lerner-Lam, M. Arnold, J. Agwe, P. Buys, O. Kjekstad, B. Lyon, and G. Yetman. 2005. Natural Disaster Hotspots: A Global Risk Analysis. Washington, D.C.: World Bank. https://doi.org/10.1596/0-8213-5930-4.
2. Center for Hazards and Risk Research - CHRR - Columbia University, Center for International Earth Science Information Network - CIESIN - Columbia University, and International Research Institute for Climate and Society - IRI - Columbia University. 2005. Global Drought Hazard Frequency and Distribution. Palisades, NY: NASA Socioeconomic Data and Applications Center (SEDAC). https://doi.org/10.7927/H4VX0DFT.
3. Center for Hazards and Risk Research - CHRR - Columbia University, Center for International Earth Science Information Network - CIESIN - Columbia University. 2005. Global Flood Hazard Frequency and Distribution. Palisades, NY: NASA Socioeconomic Data and Applications Center (SEDAC). https://doi.org/10.7927/H4668B3D.
データについて
このページのデータは、公開されている多くのツールとリソースを使用して推定されています。保証なしで提供され、不正確な内容が含まれている可能性があります。自己責任。詳細については、 こちらをご覧ください。